




Dima's Spotify · 2012 – 2026
10,133 hours. 147,594 streams. 14 years. Here's what the data says about who I am.
Two eras, same listener. 2012–2014 was DnB-obsessed, catalog-deep, London Elektricity at the top. 2023–2024 shows a taste that's wider, stranger, harder to categorize. The only constant is intensity.
Genre share: then vs now
Genre distribution shifted dramatically — from DnB dominance to a diverse mix of World, Chillout, and Electronic.
Fourteen years of data tells a story in peaks and valleys — and one unmistakable spike. 2020 wasn't just a year of more music. It was the year music became infrastructure. With nowhere to go, headphones were the most reliable portal to anywhere else.
The drop after 2020 wasn't disengagement — it was re-entry. Life resumed, and music became part of it rather than the entirety of it. By 2025, the listening had shifted: quieter, later at night, more functional.
2020: 1,236 hours. One in every seven hours of that year had something playing. That's not background music — that's music as the structure of a day.
Listening hours by year, 2012–2026 (music only). Hover for exact figures.
Monthly listening volume — every month from January 2012 to April 2026. The 2020 lockdown is the mountain on the left side of the right half.
Across fourteen years and 15,748 unique artists, listening habits show something interesting: enormous breadth with concentrated depth. The top 20 music artists account for roughly 8.7% of all listening — everything else is a long tail of discovery, phases, and one-time encounters.
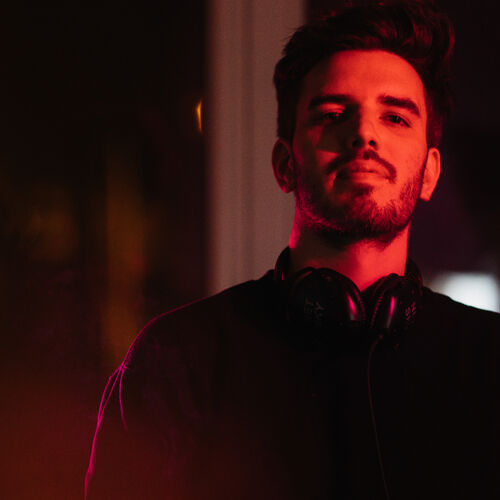
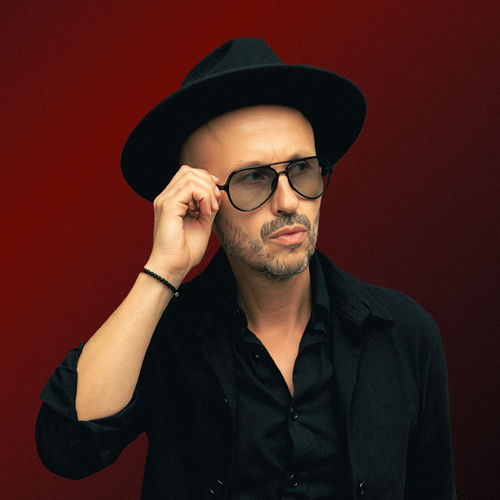
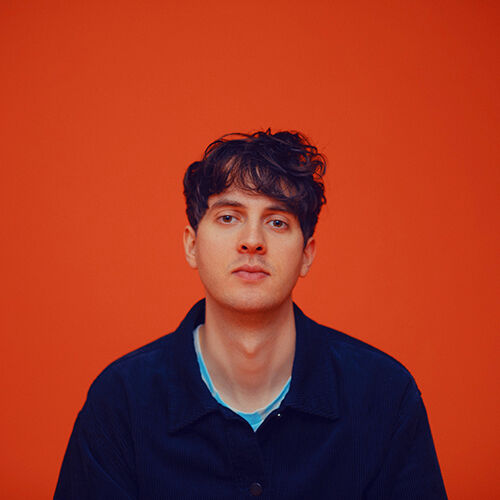
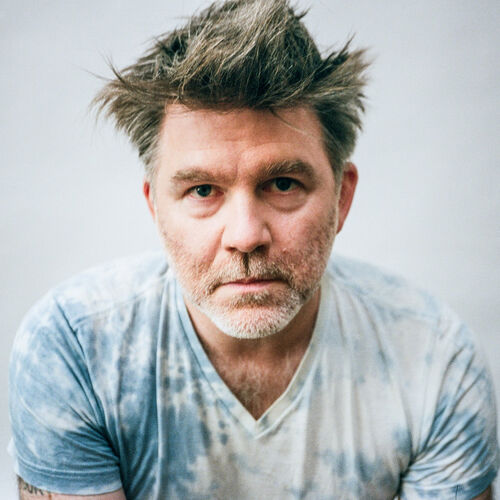
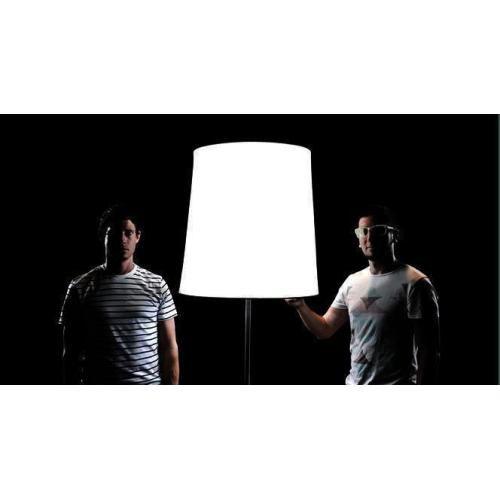
Netsky sits at #1 all-time — 1,633 streams and 123.8 hours of drum and bass that defined the early years.
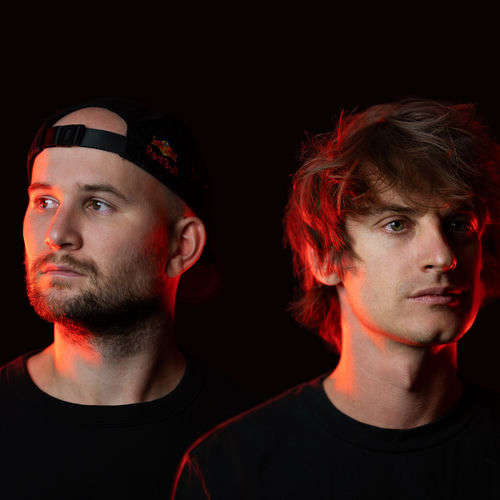
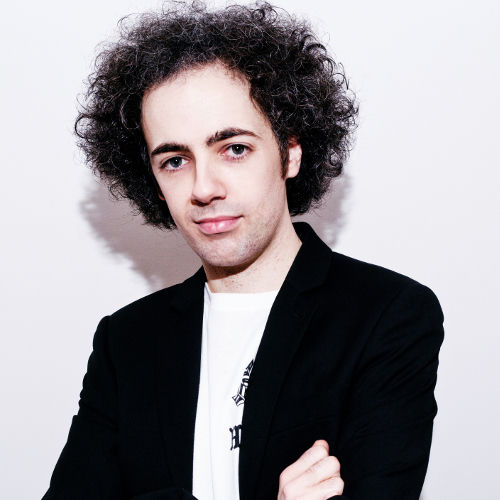
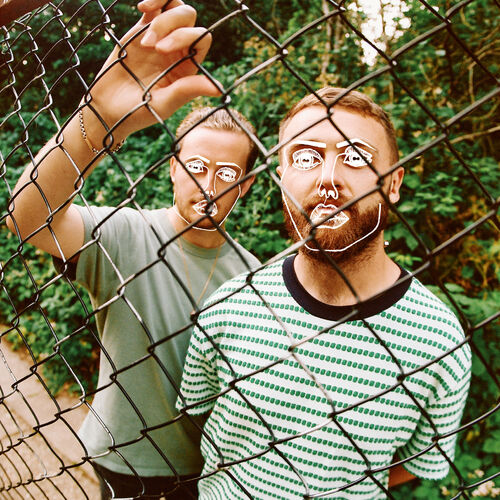
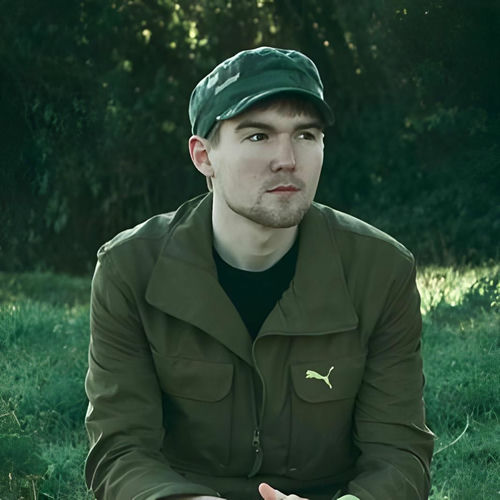
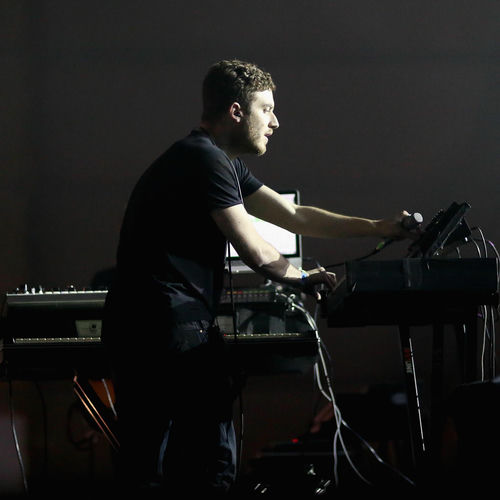
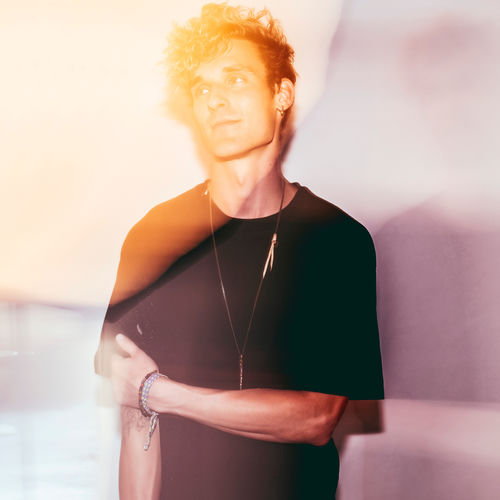
Camo & Krooked at #2 and London Elektricity at #6 tell the same story: a DnB era, deep and committed.
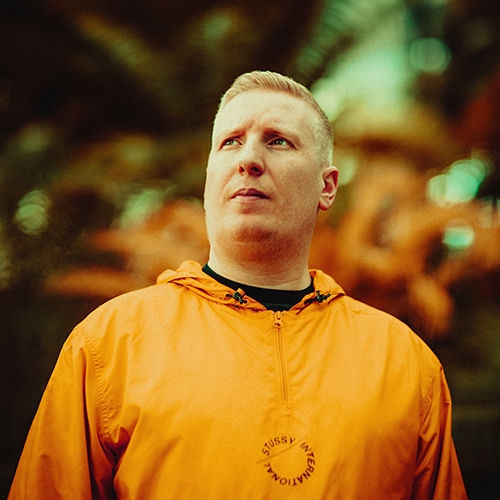
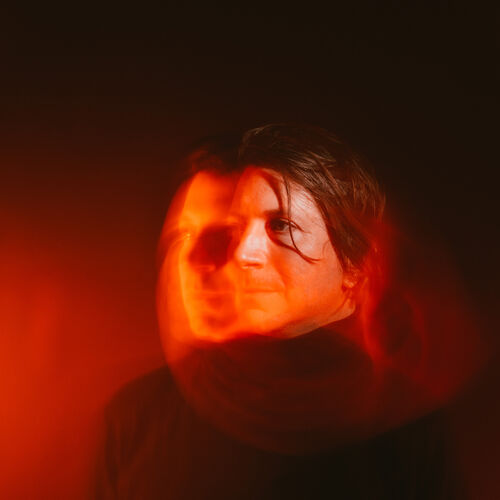
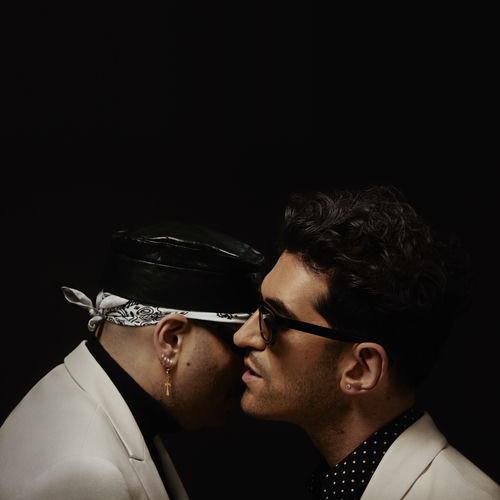
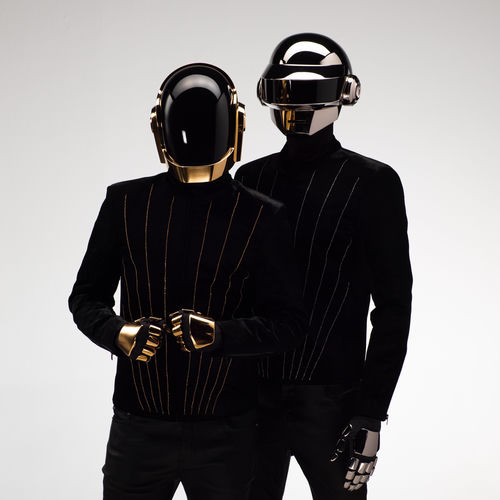
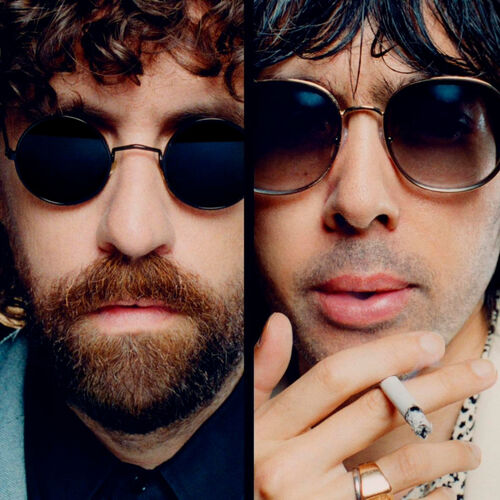
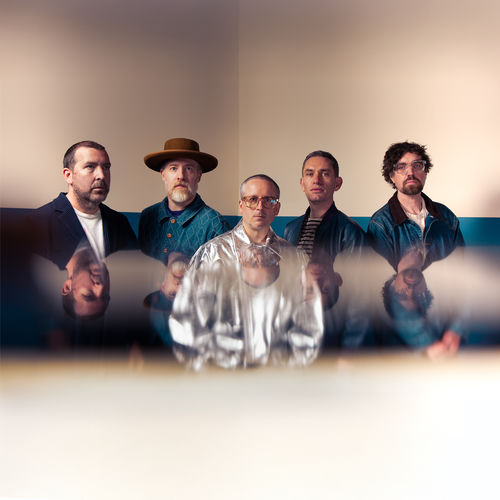
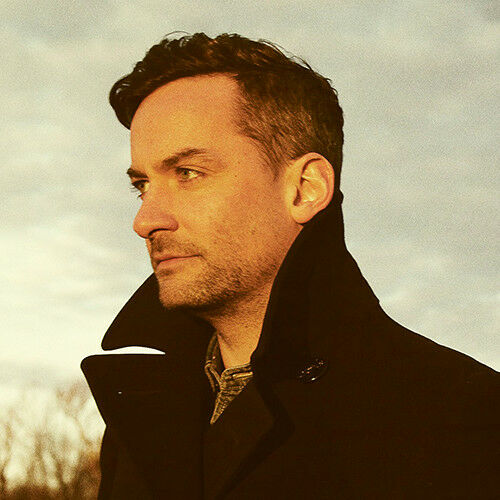
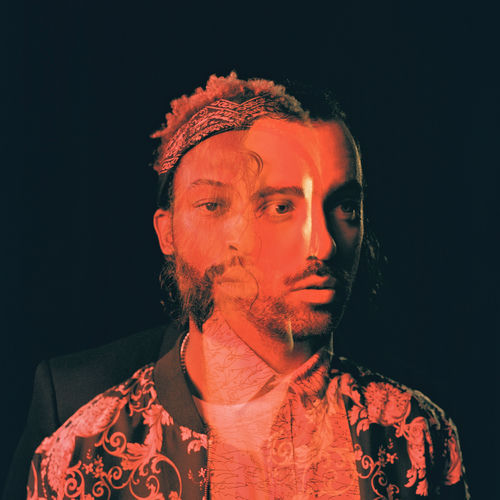
Top 15 music artists by total listening hours, 2012–2026. Hover for streams and hours. Artist photos appear at bar ends.
One year wonders — artists who dominated a single year, then vanished
Phase artists — colored by era (blue=2012, green=2013–16, purple=2017–19, teal=2020–23, amber=2024+). Hover for details.
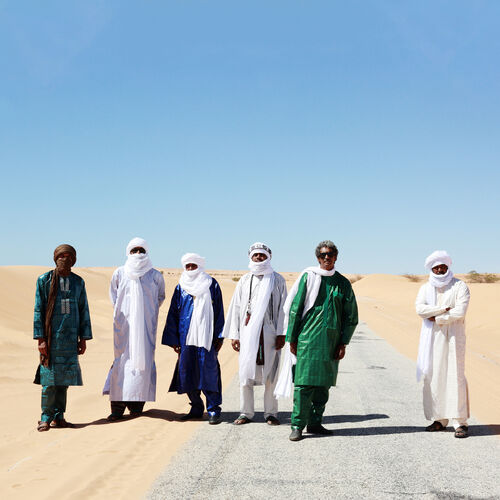
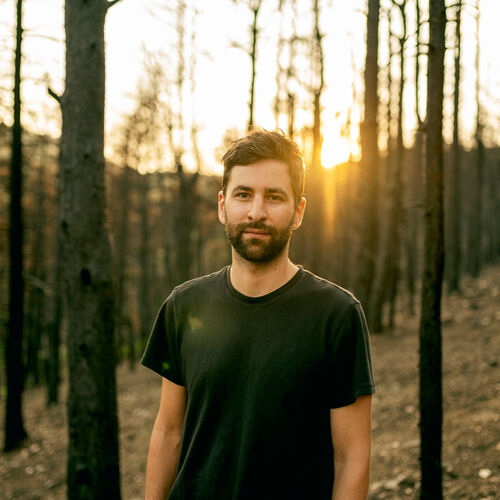
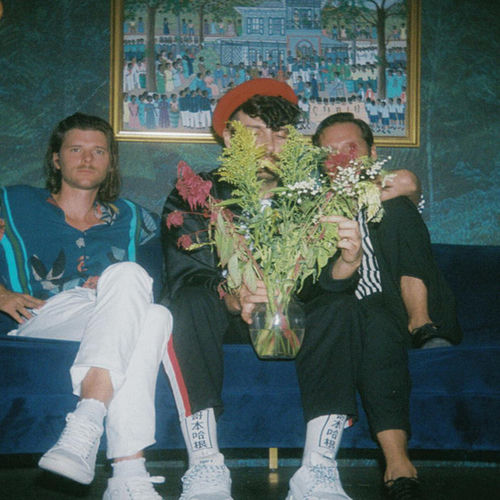
Tinariwen: first heard May 2024. By the end of that year, they were #1 by total plays.
The Tuareg guitar band from the Sahara went from unknown to completely dominant in under eight months —
one of the fastest artist ascents in this entire dataset.
Tracks from the collection

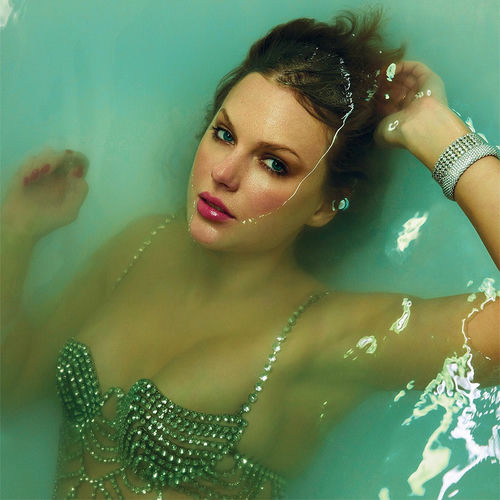
7 years of Spotify data isn't one story — it's three. The main analysis covers my actual music. But mixed in are 18 hours of kids' songs and 10 hours of Taylor Swift (Jeannie's).
Listening isn't random. The data reveals strong temporal patterns: when music plays, how often songs get abandoned, and how that behavior has changed over time. Early years showed a listener who heard things through. Recent years show someone with higher standards — or less patience.
The skip rate tells a particularly clear story. From 2019 to 2021, the skip rate was essentially zero — music was playing and playing through. By 2026, 38.6% of songs get skipped. That's a listener who knows exactly what they want, and won't sit through anything that isn't it.
Listening by hour — color intensity = volume. The late-night cluster is real.
Skip rate by year — from patience to zero tolerance.
Spotify's audio features include a "valence" score: a 0–1 measure of musical positivity. High valence means bright, happy, euphoric. Low valence means somber, melancholic, dark. Mapped across fourteen years of listening, this isn't just musical data — it's a mood diary.
The arc of 2020 is visible in the valence data: early lockdown brought a flood of high-energy, positive music — the kind that keeps panic at bay. By mid-year, that gave way to something quieter. The emotional fingerprint shifts with real life.
Musical valence (positivity) over time — hover for monthly detail. Key events annotated.
Algorithmic chapter detection — clustering listening patterns by artist mix, volume, timing, and audio features — can find boundaries in the data that correspond to real-life transitions. Not labeled, not pre-defined. Just: the music changed here, and here, and here.
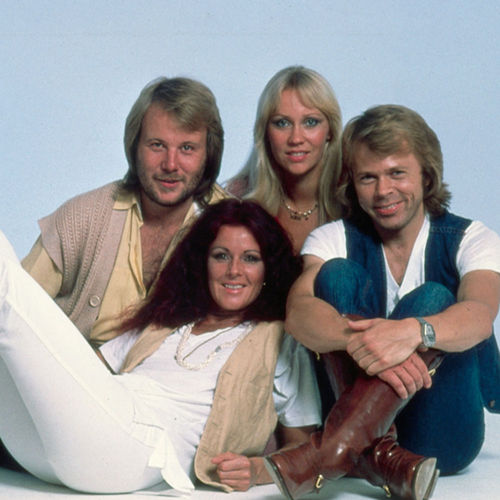
Some boundaries are obvious in retrospect. The March 2020 lockdown. The 2021 period when ABBA took over. The spring of 2025. Others are subtler: a gradual drift in genre, a shift in listening hours, a new artist entering the mix who slowly displaces everything else.
ABBA went #1 in 2021. Nowhere to go, music became constant.
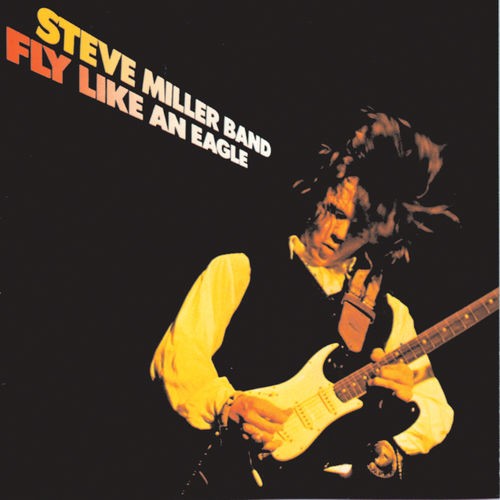
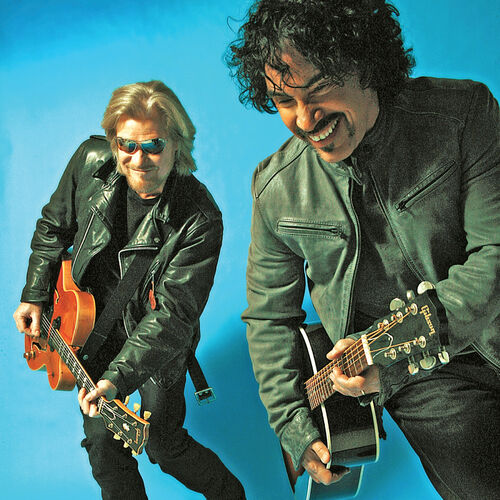 Hall & Oates and
 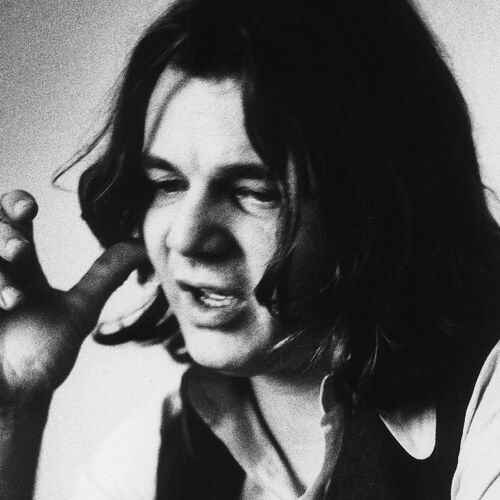 Steve Miller Band. 37.5 avg hours/month. A brief reset — familiar, comfortable, retrospective.
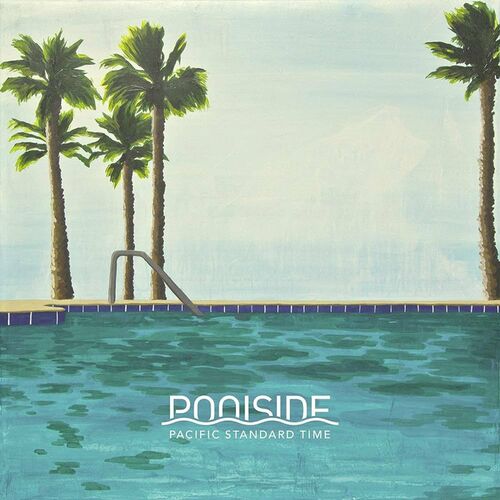
Poolside, and the first kids' music in the dataset. Diversity peaked. 46.9 avg hours/month, highest unique artist count.
Tinariwen discovered in May 2024, immediately consumed everything. Shuffle rate spiked to 48.5% — maximum exploration mode.
Tinariwen and The Kiboomers side by side. Shorter sessions, interrupted routines.
Tinariwen and
Steve Miller Band. 37.5 avg hours/month. A brief reset — familiar, comfortable, retrospective.
Poolside, and the first kids' music in the dataset. Diversity peaked. 46.9 avg hours/month, highest unique artist count.
Tinariwen discovered in May 2024, immediately consumed everything. Shuffle rate spiked to 48.5% — maximum exploration mode.
Tinariwen and The Kiboomers side by side. Shorter sessions, interrupted routines.
Tinariwen and 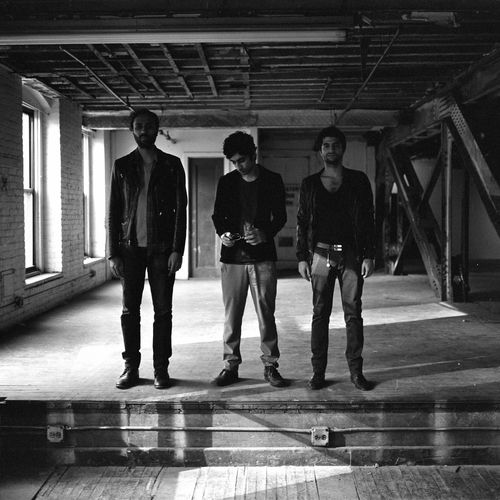 Dawn of Midi carry the late hours.
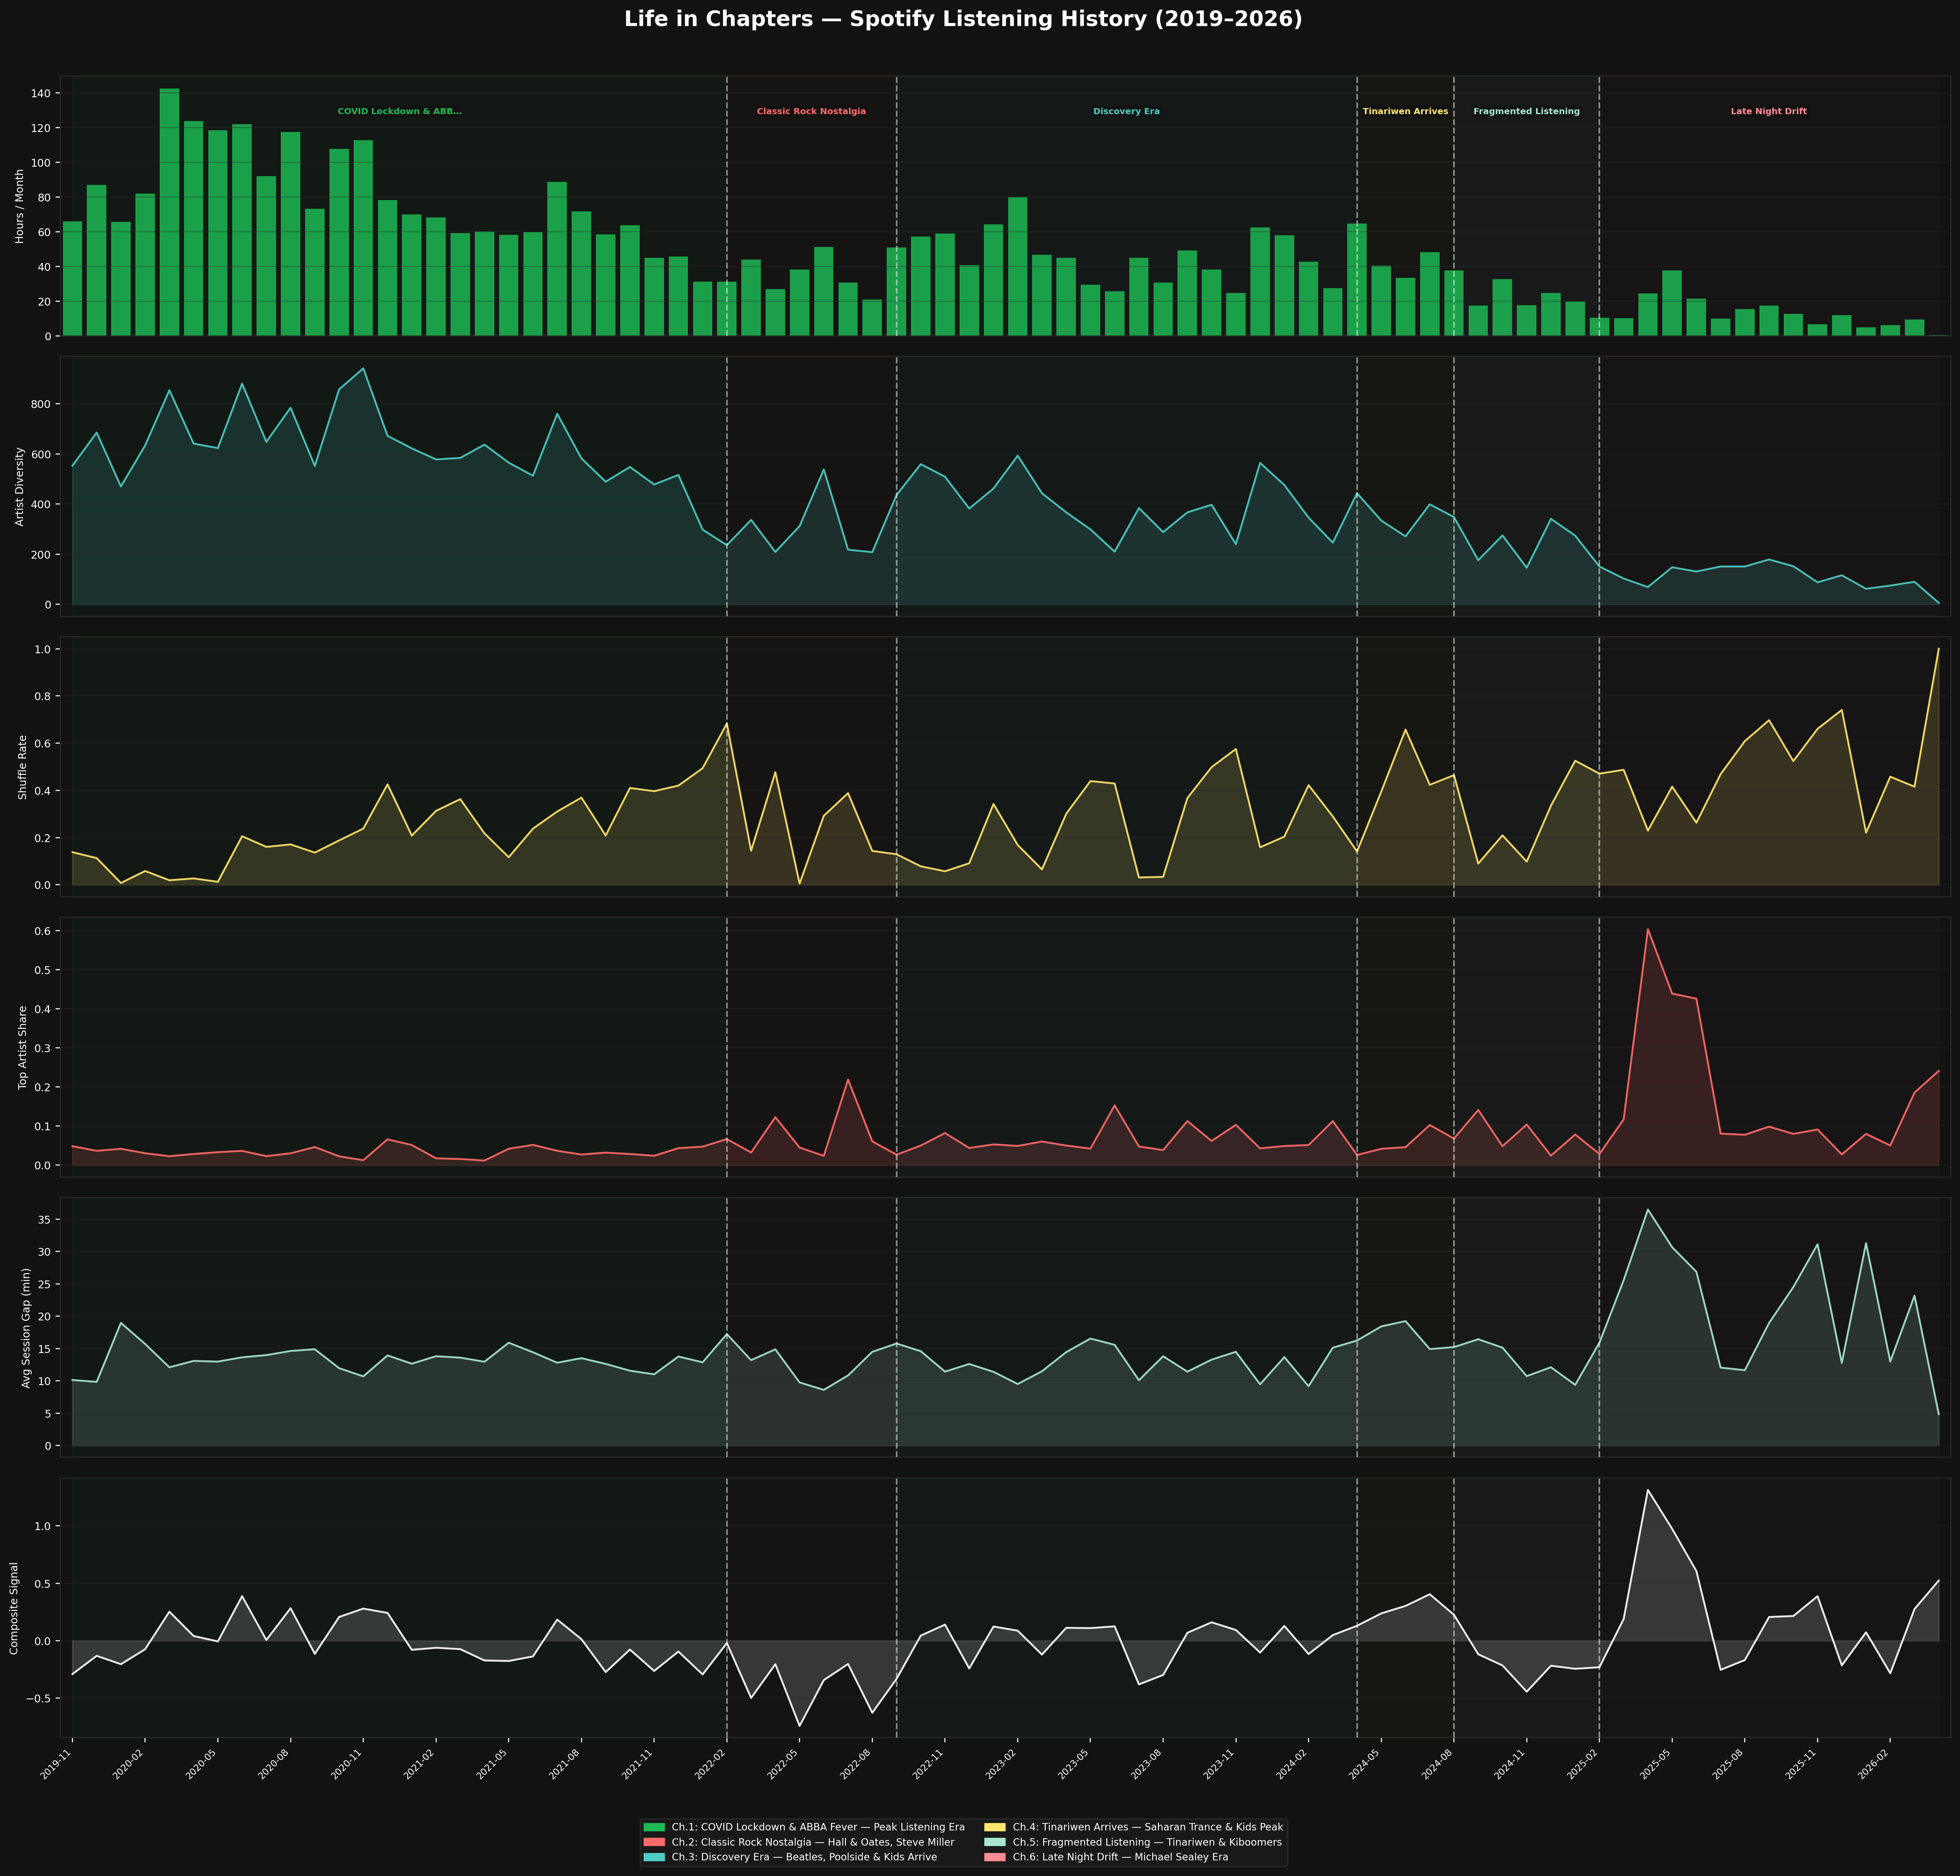
Algorithmically detected life chapters — boundaries where the music changed enough to mark a new era.
Music psychology research has found consistent links between listening preferences and the Big Five personality traits. Openness to experience correlates with genre diversity and niche exploration. Conscientiousness shows up in replay patterns. Extraversion has a signature in tempo and energy preferences.
With 15,748 unique artists and a dataset spanning fourteen years, there's enough signal to make reasonable inferences. The personality radar that emerges is less a definitive statement about who you are and more a reflection — your musical fingerprint, rendered as psychology.
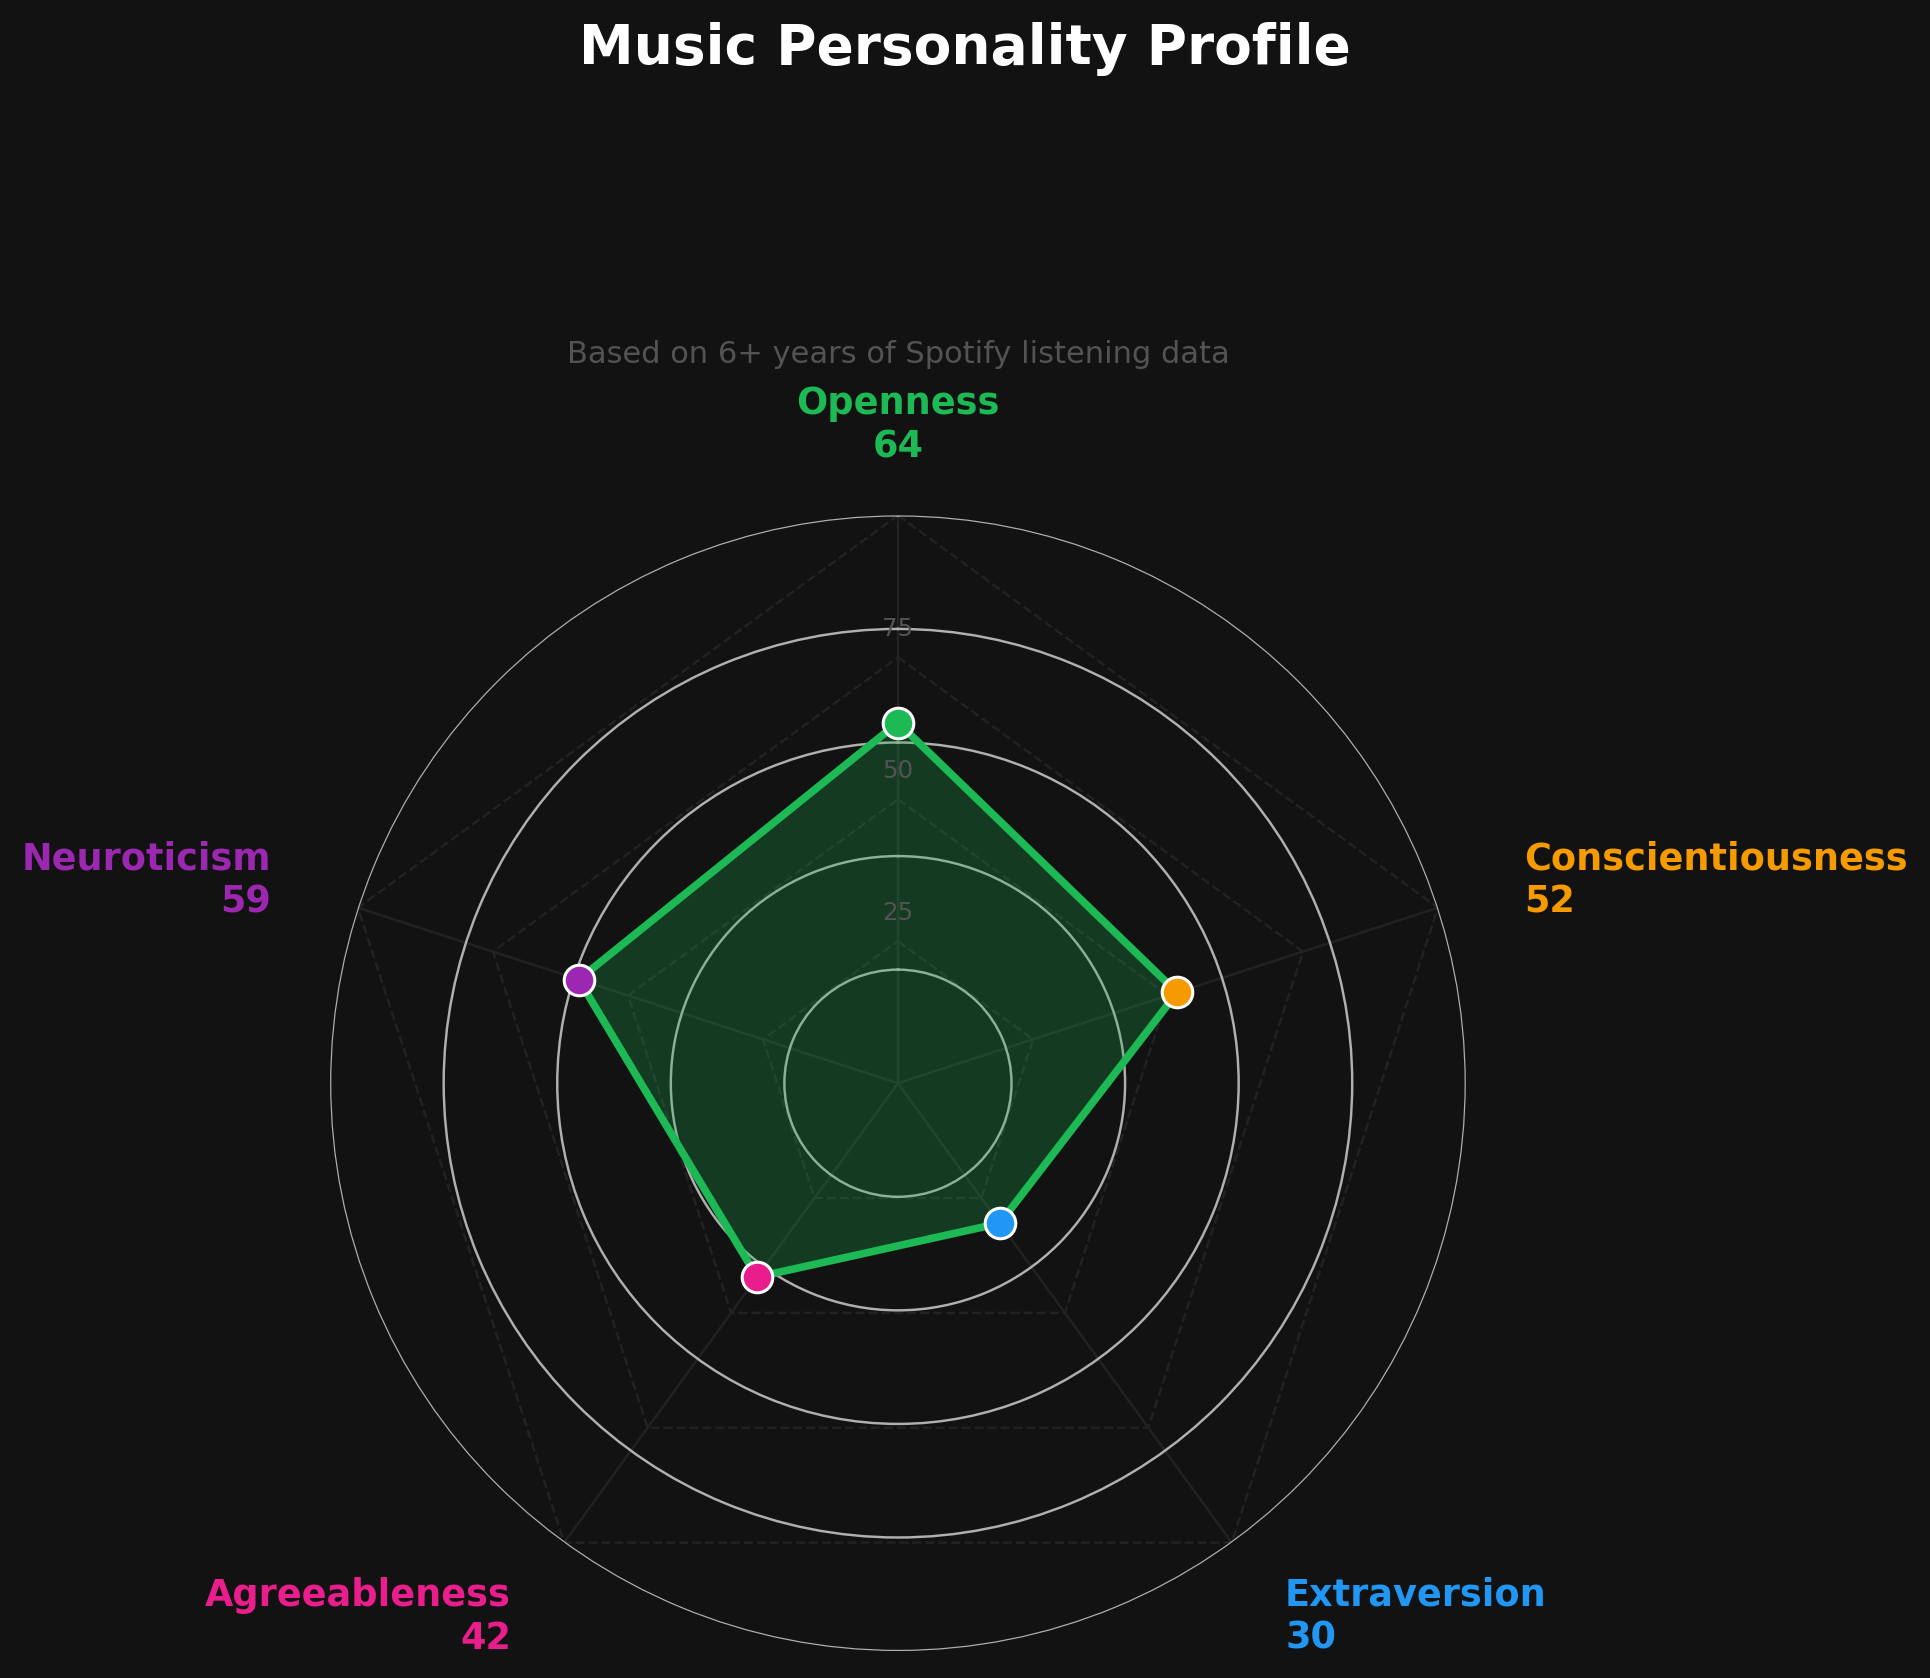
Big Five personality radar derived from fourteen years of listening patterns.
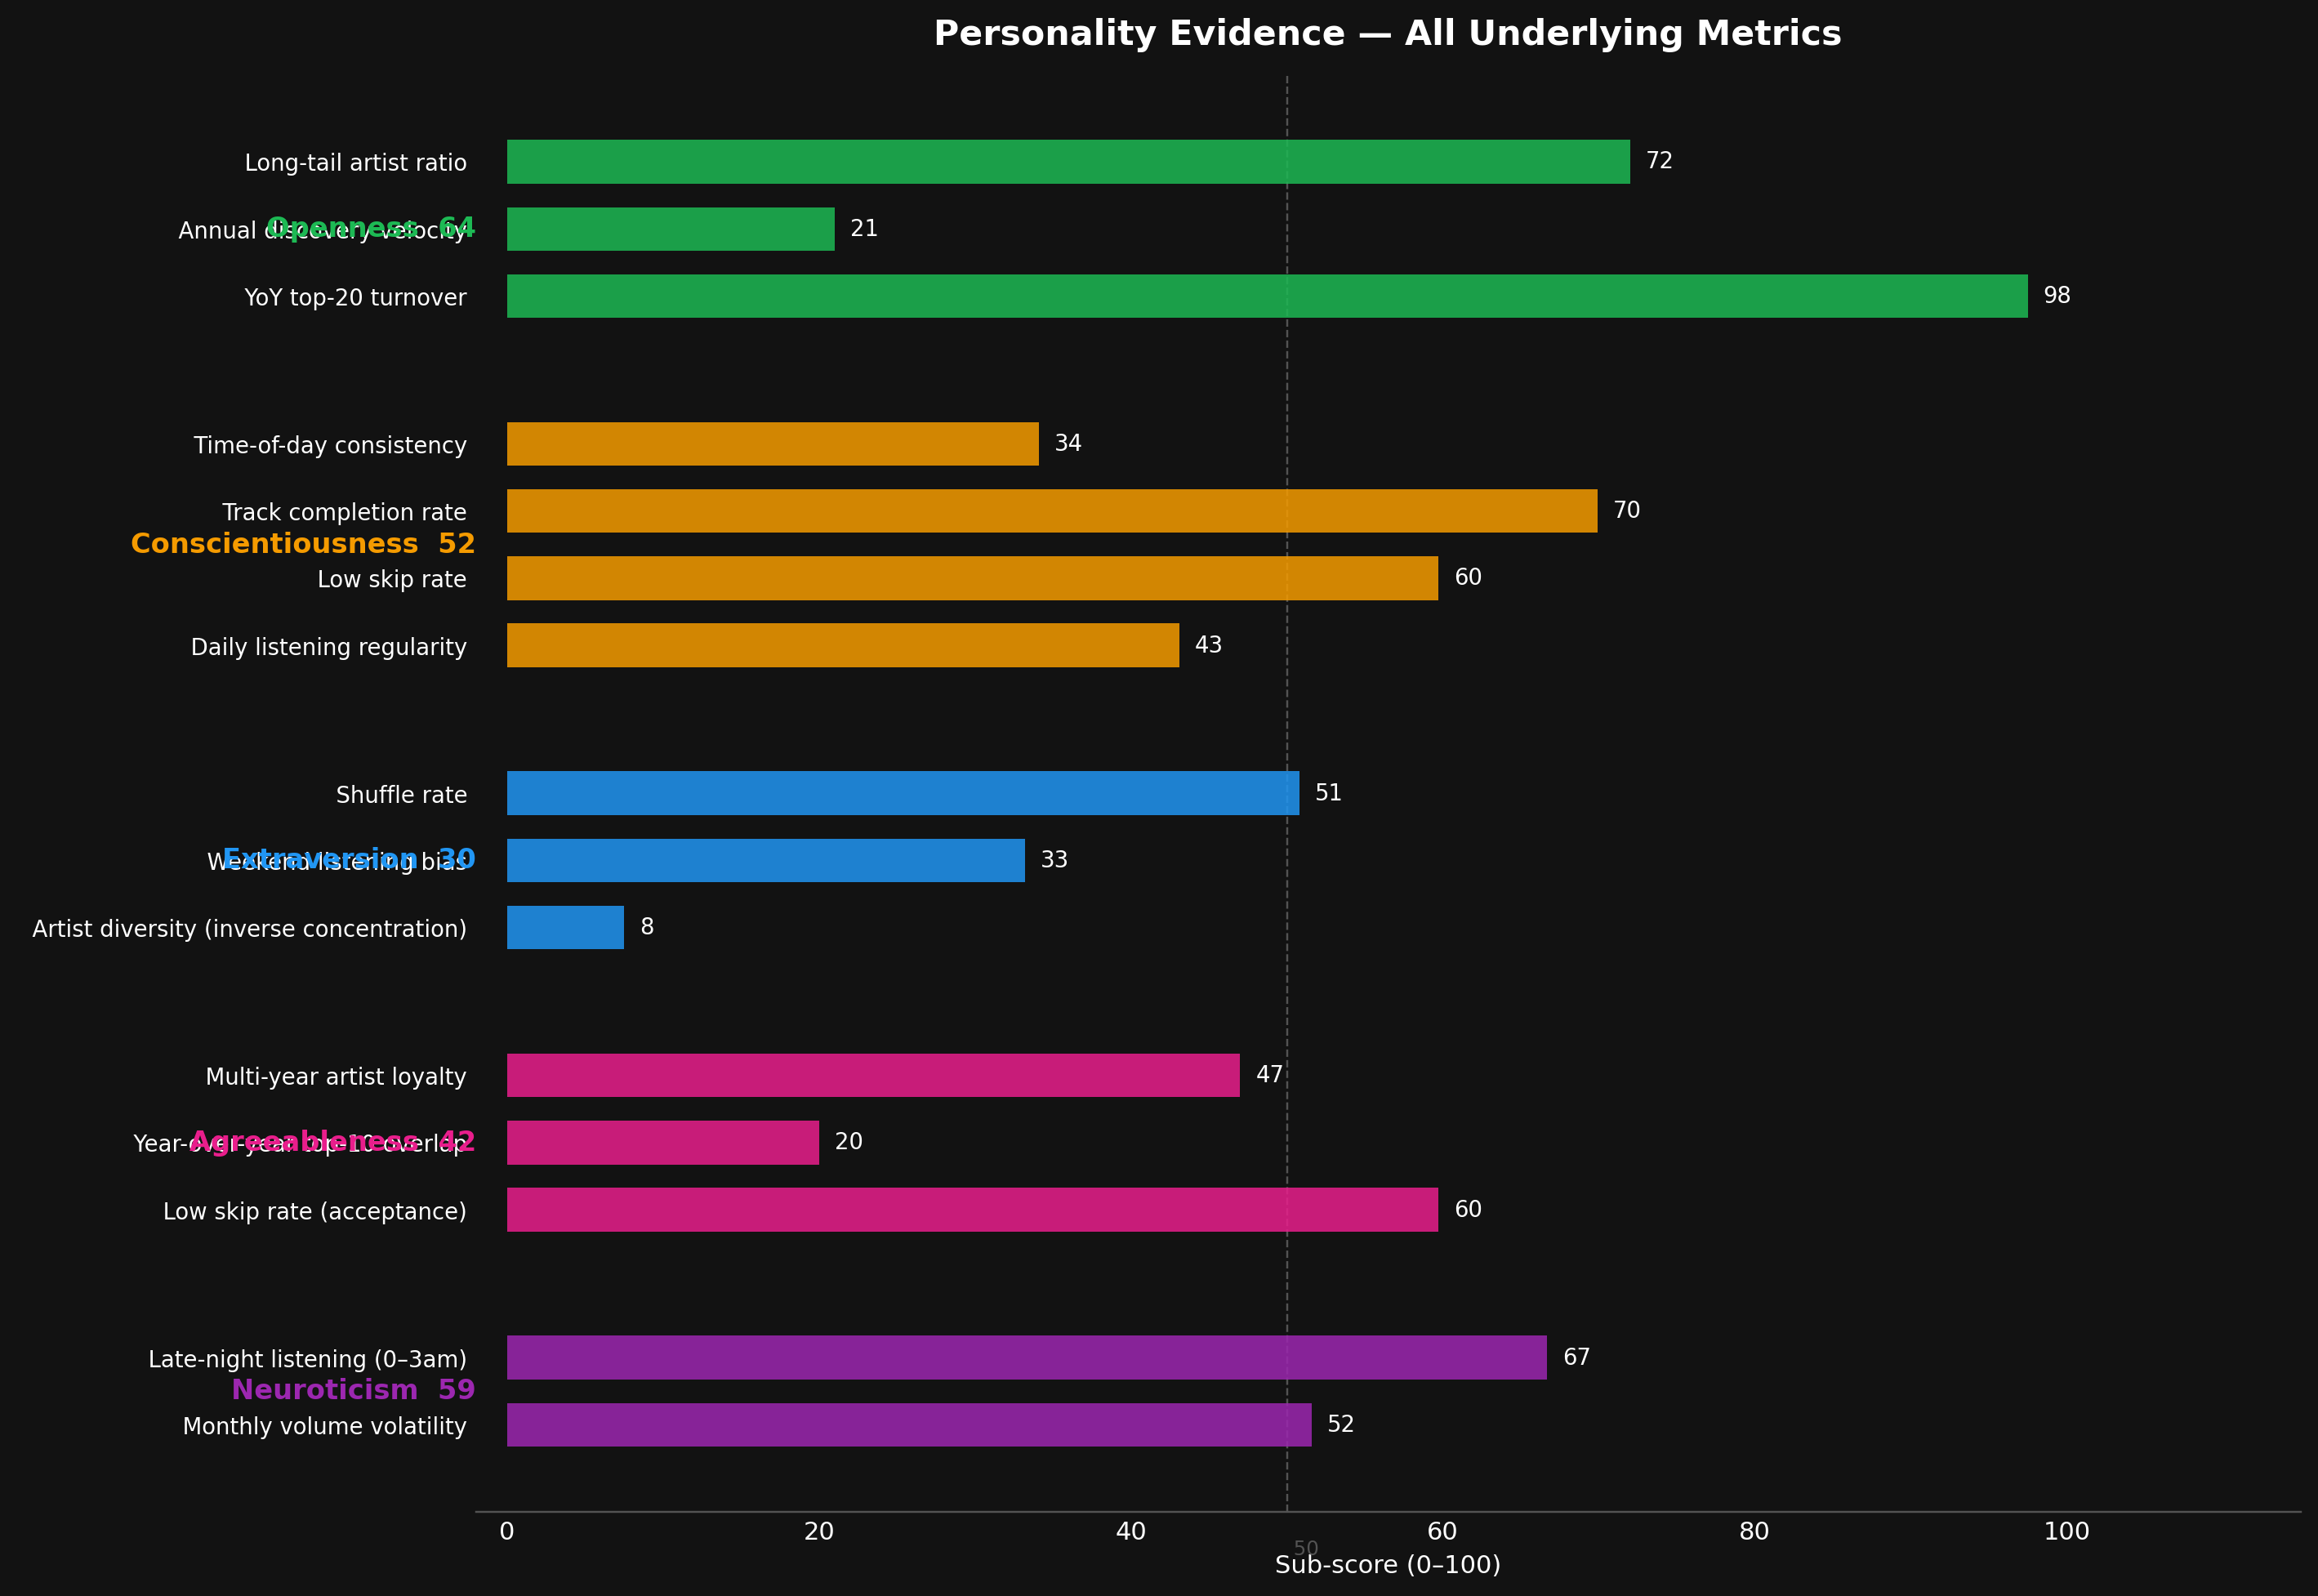
The underlying metrics that inform each personality dimension.
Not all listening is equal. Shuffling a playlist is different from deliberately seeking out a specific artist. The data distinguishes between these modes — and reveals something about the state of mind behind each session. Morning listening looks different from evening listening. Mobile listening differs from desktop.
The 3-way categorization of the listening corpus tells another version of this story: 98.2% is music, but the remaining 1.8% reveals a lot. Kids content at 0.5% — a window into shared listening. And 0.3% that is, identifiably, someone else's playlist entirely.
Three listener categories emerged from the full dataset: My Music (98.2%), Kids Content (0.5%), and Jeannie/Taylor Swift (0.3%) — the 0.3% being exactly what it sounds like: someone else's listening, logged under this account.
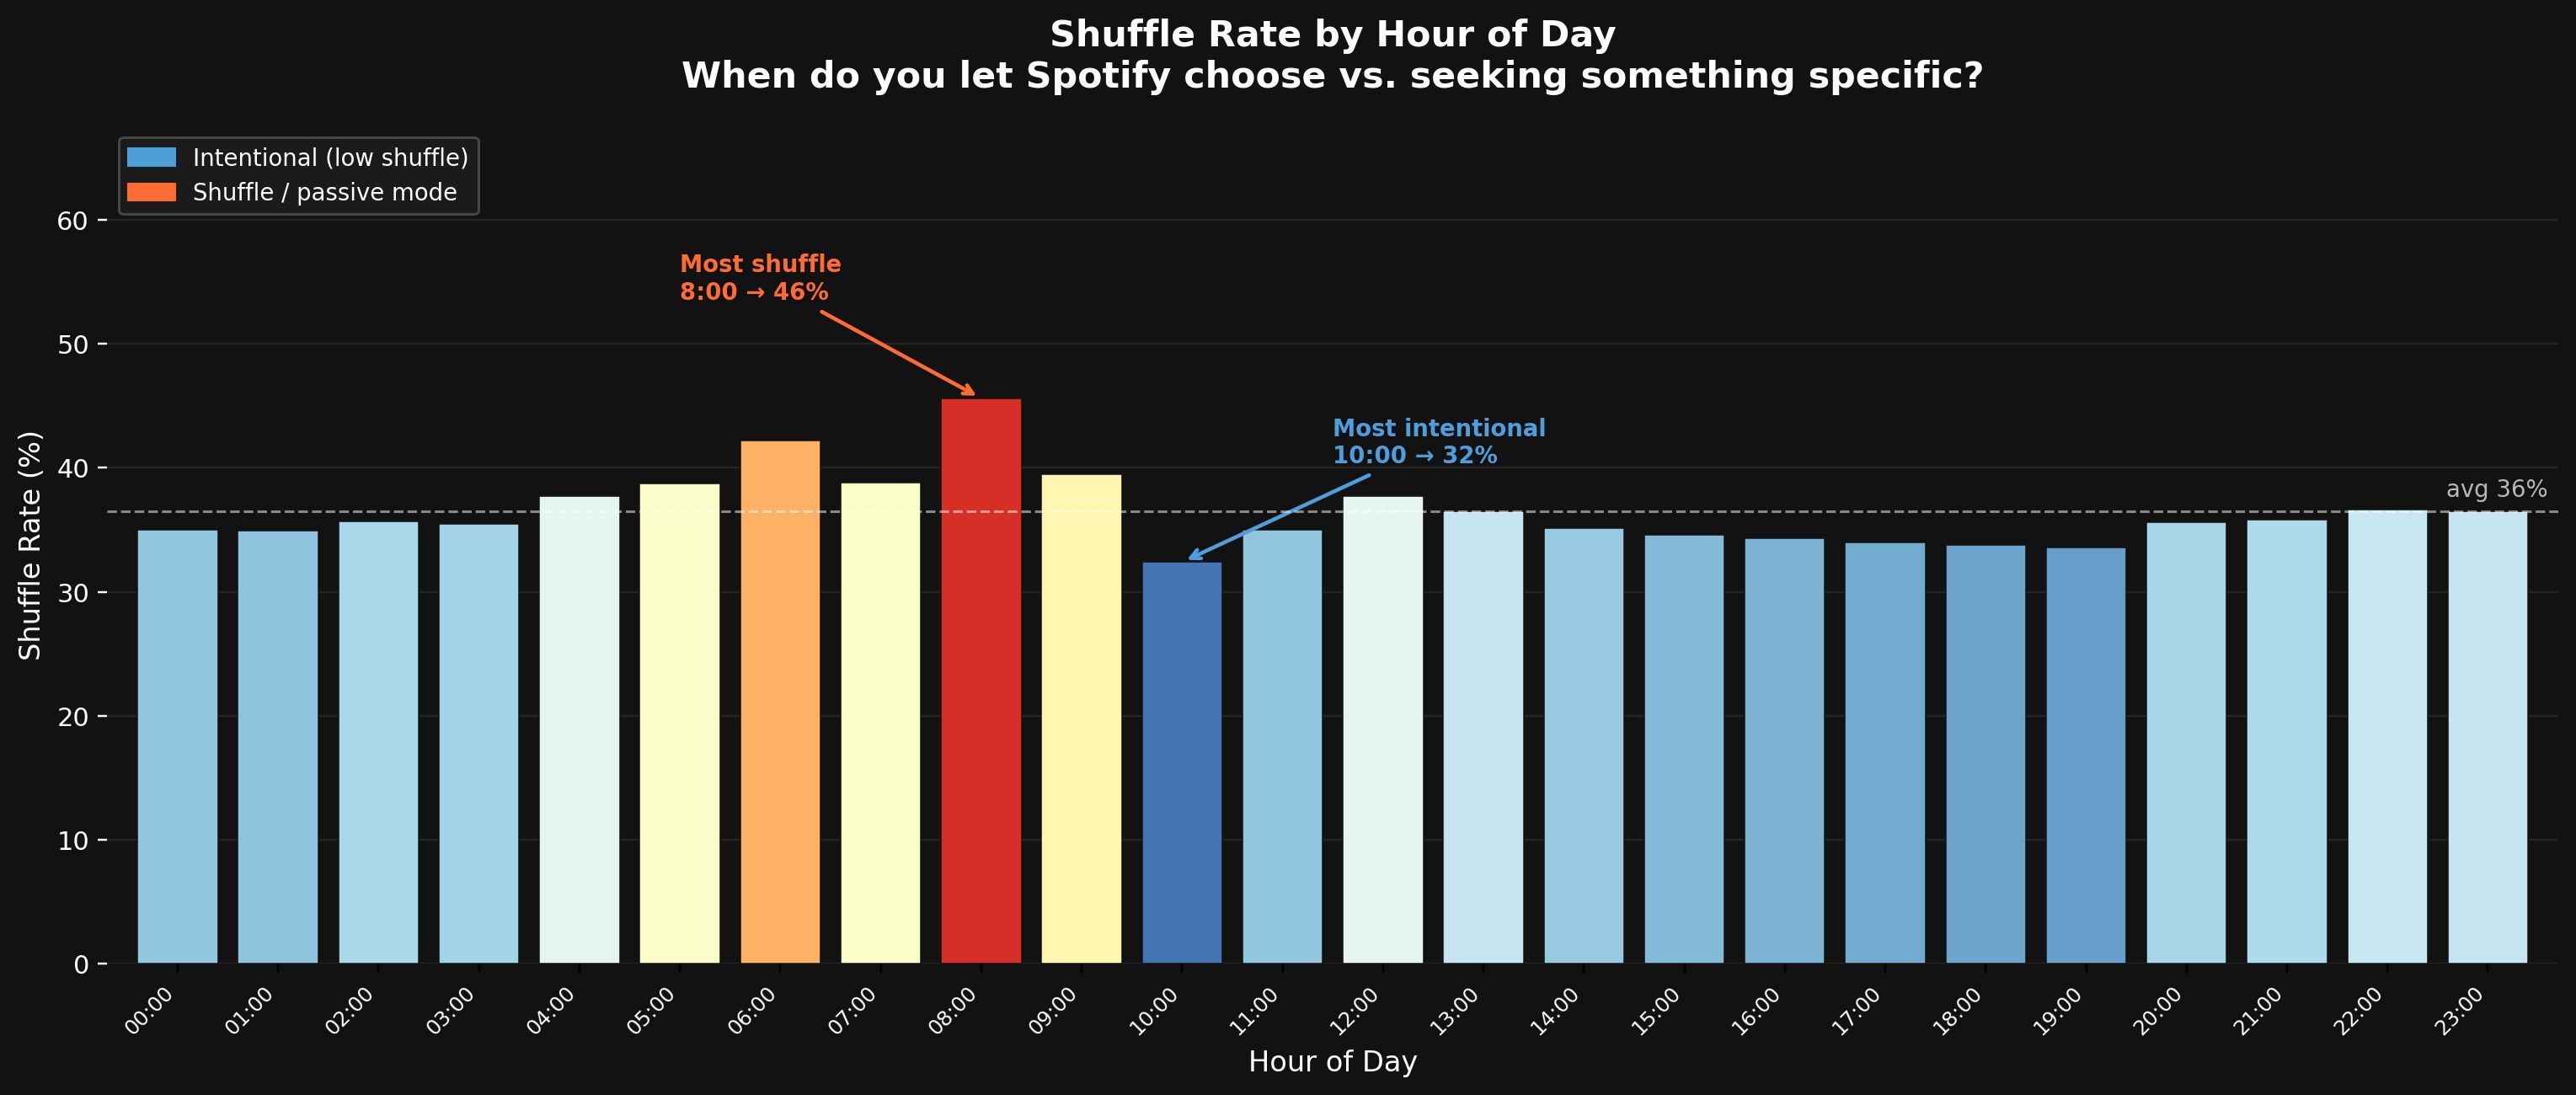
When does shuffle happen vs. intentional listening? The pattern shifts by hour.
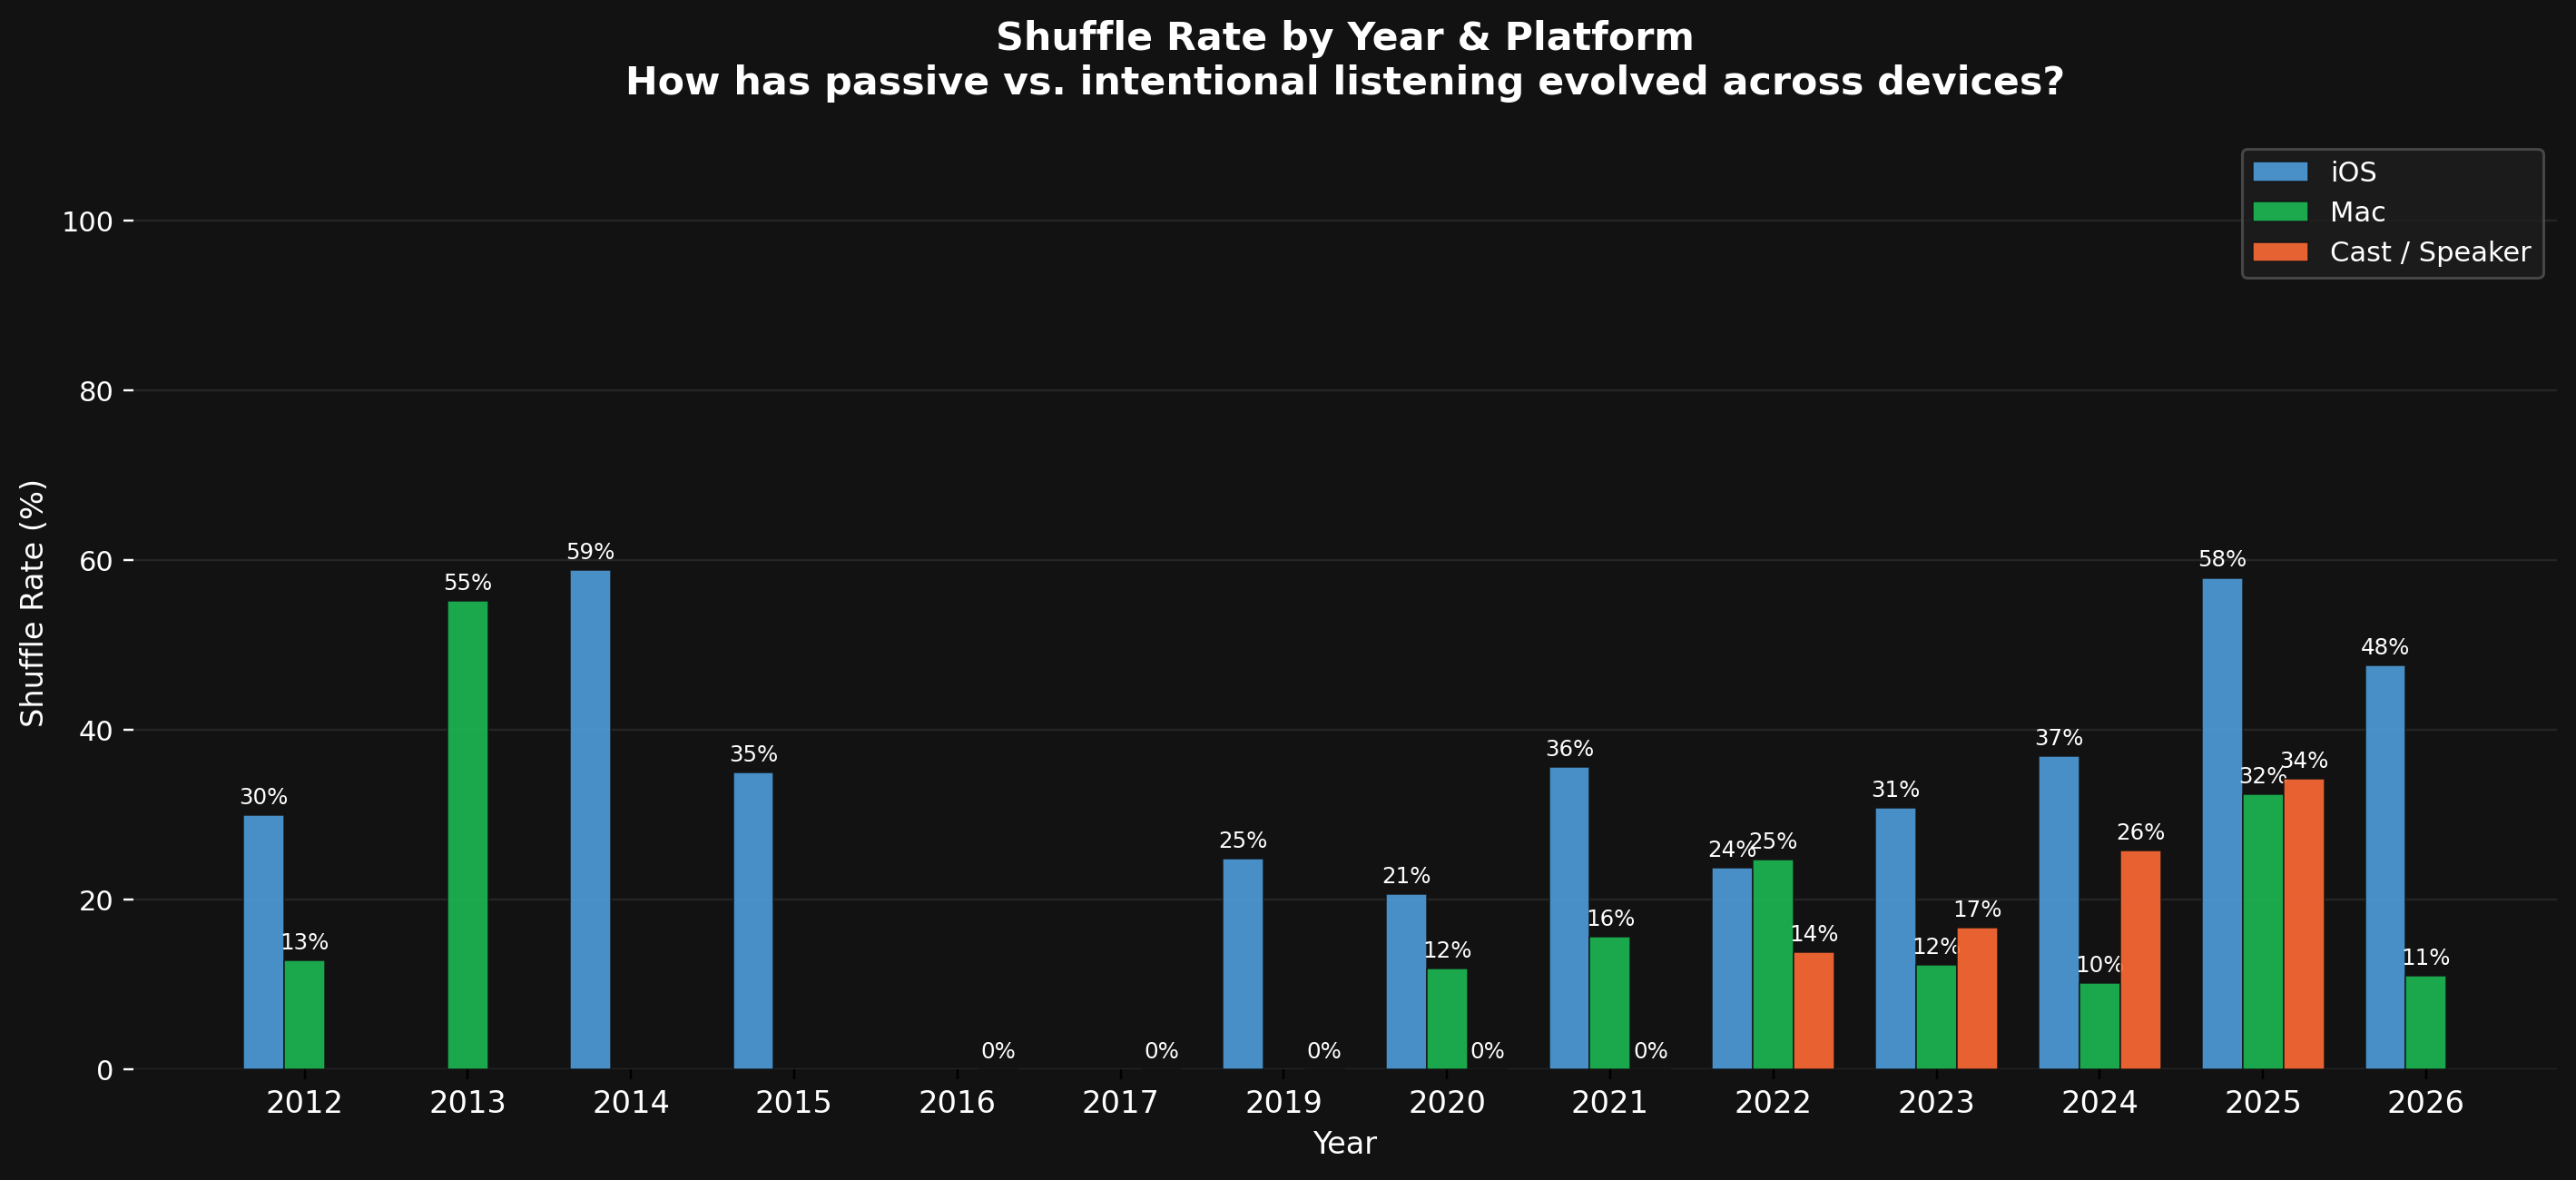
Shuffle behavior by year and device — mobile vs. desktop listening differs.
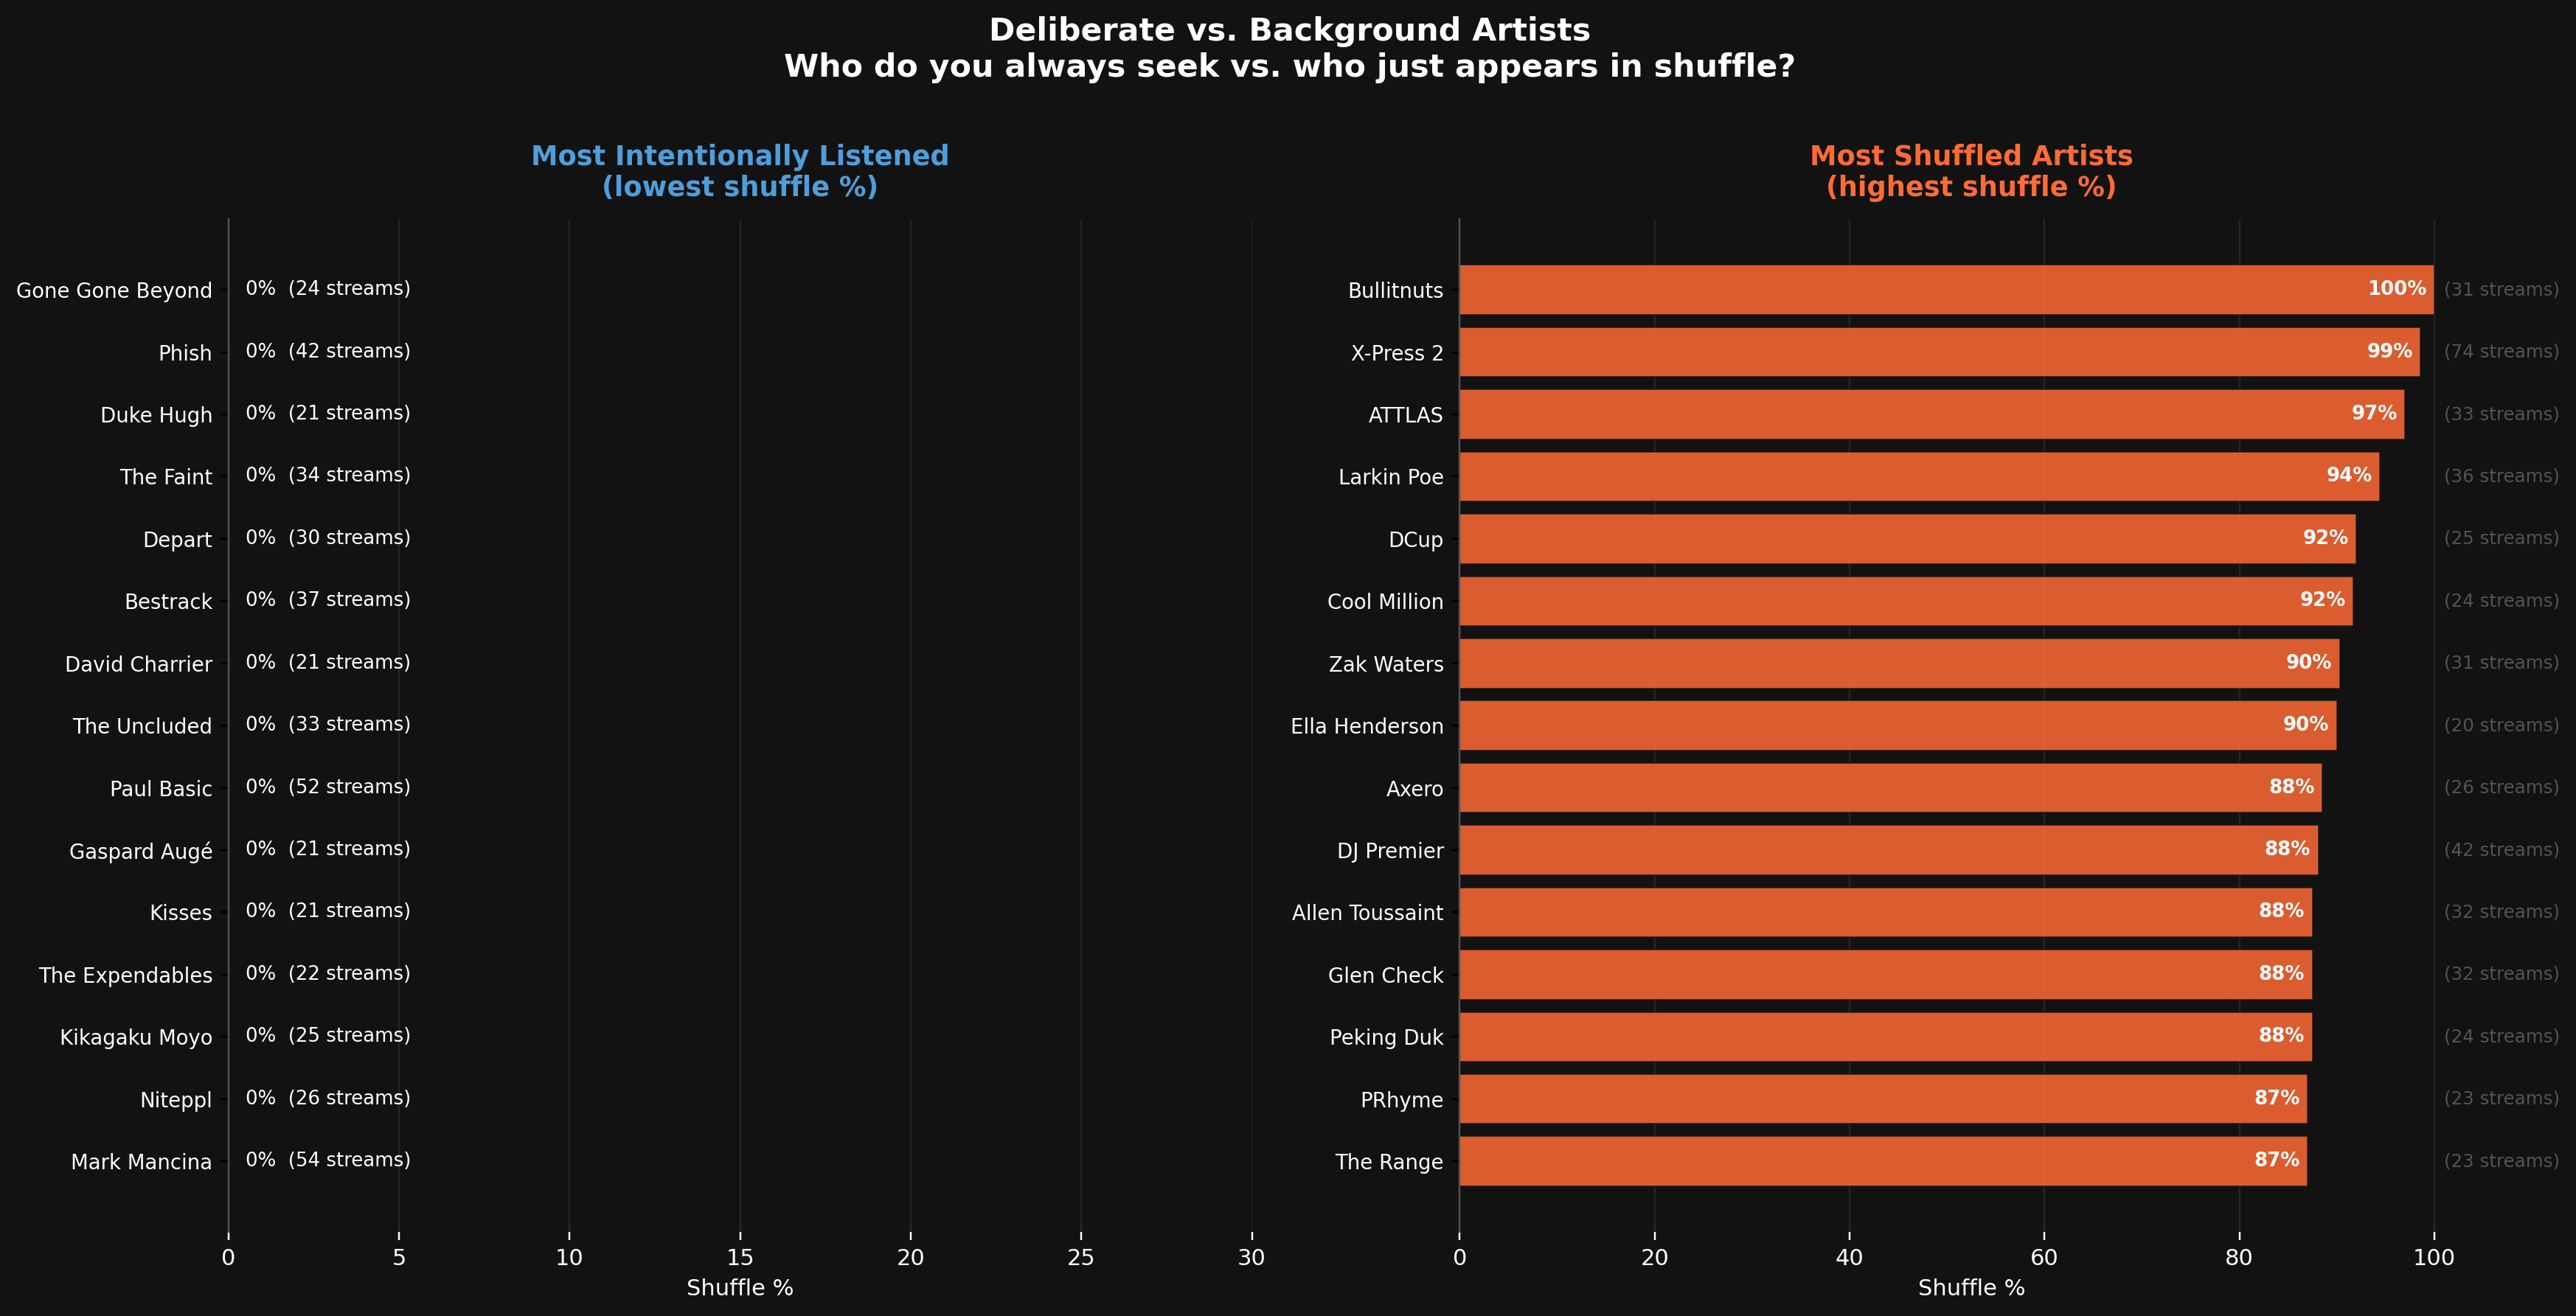
Which artists get sought out intentionally vs. discovered through shuffle?
6,274 listening sessions over 7 years. The median is 16.5 minutes — a commute, a task, a transition. But 19% of sessions run longer than an hour, and 439 times you went full spree: two hours or more of continuous music without surfacing.
The longest was February 4, 2024 — 11.6 hours straight. That's not background music. That's something happening that needed sound to get through.
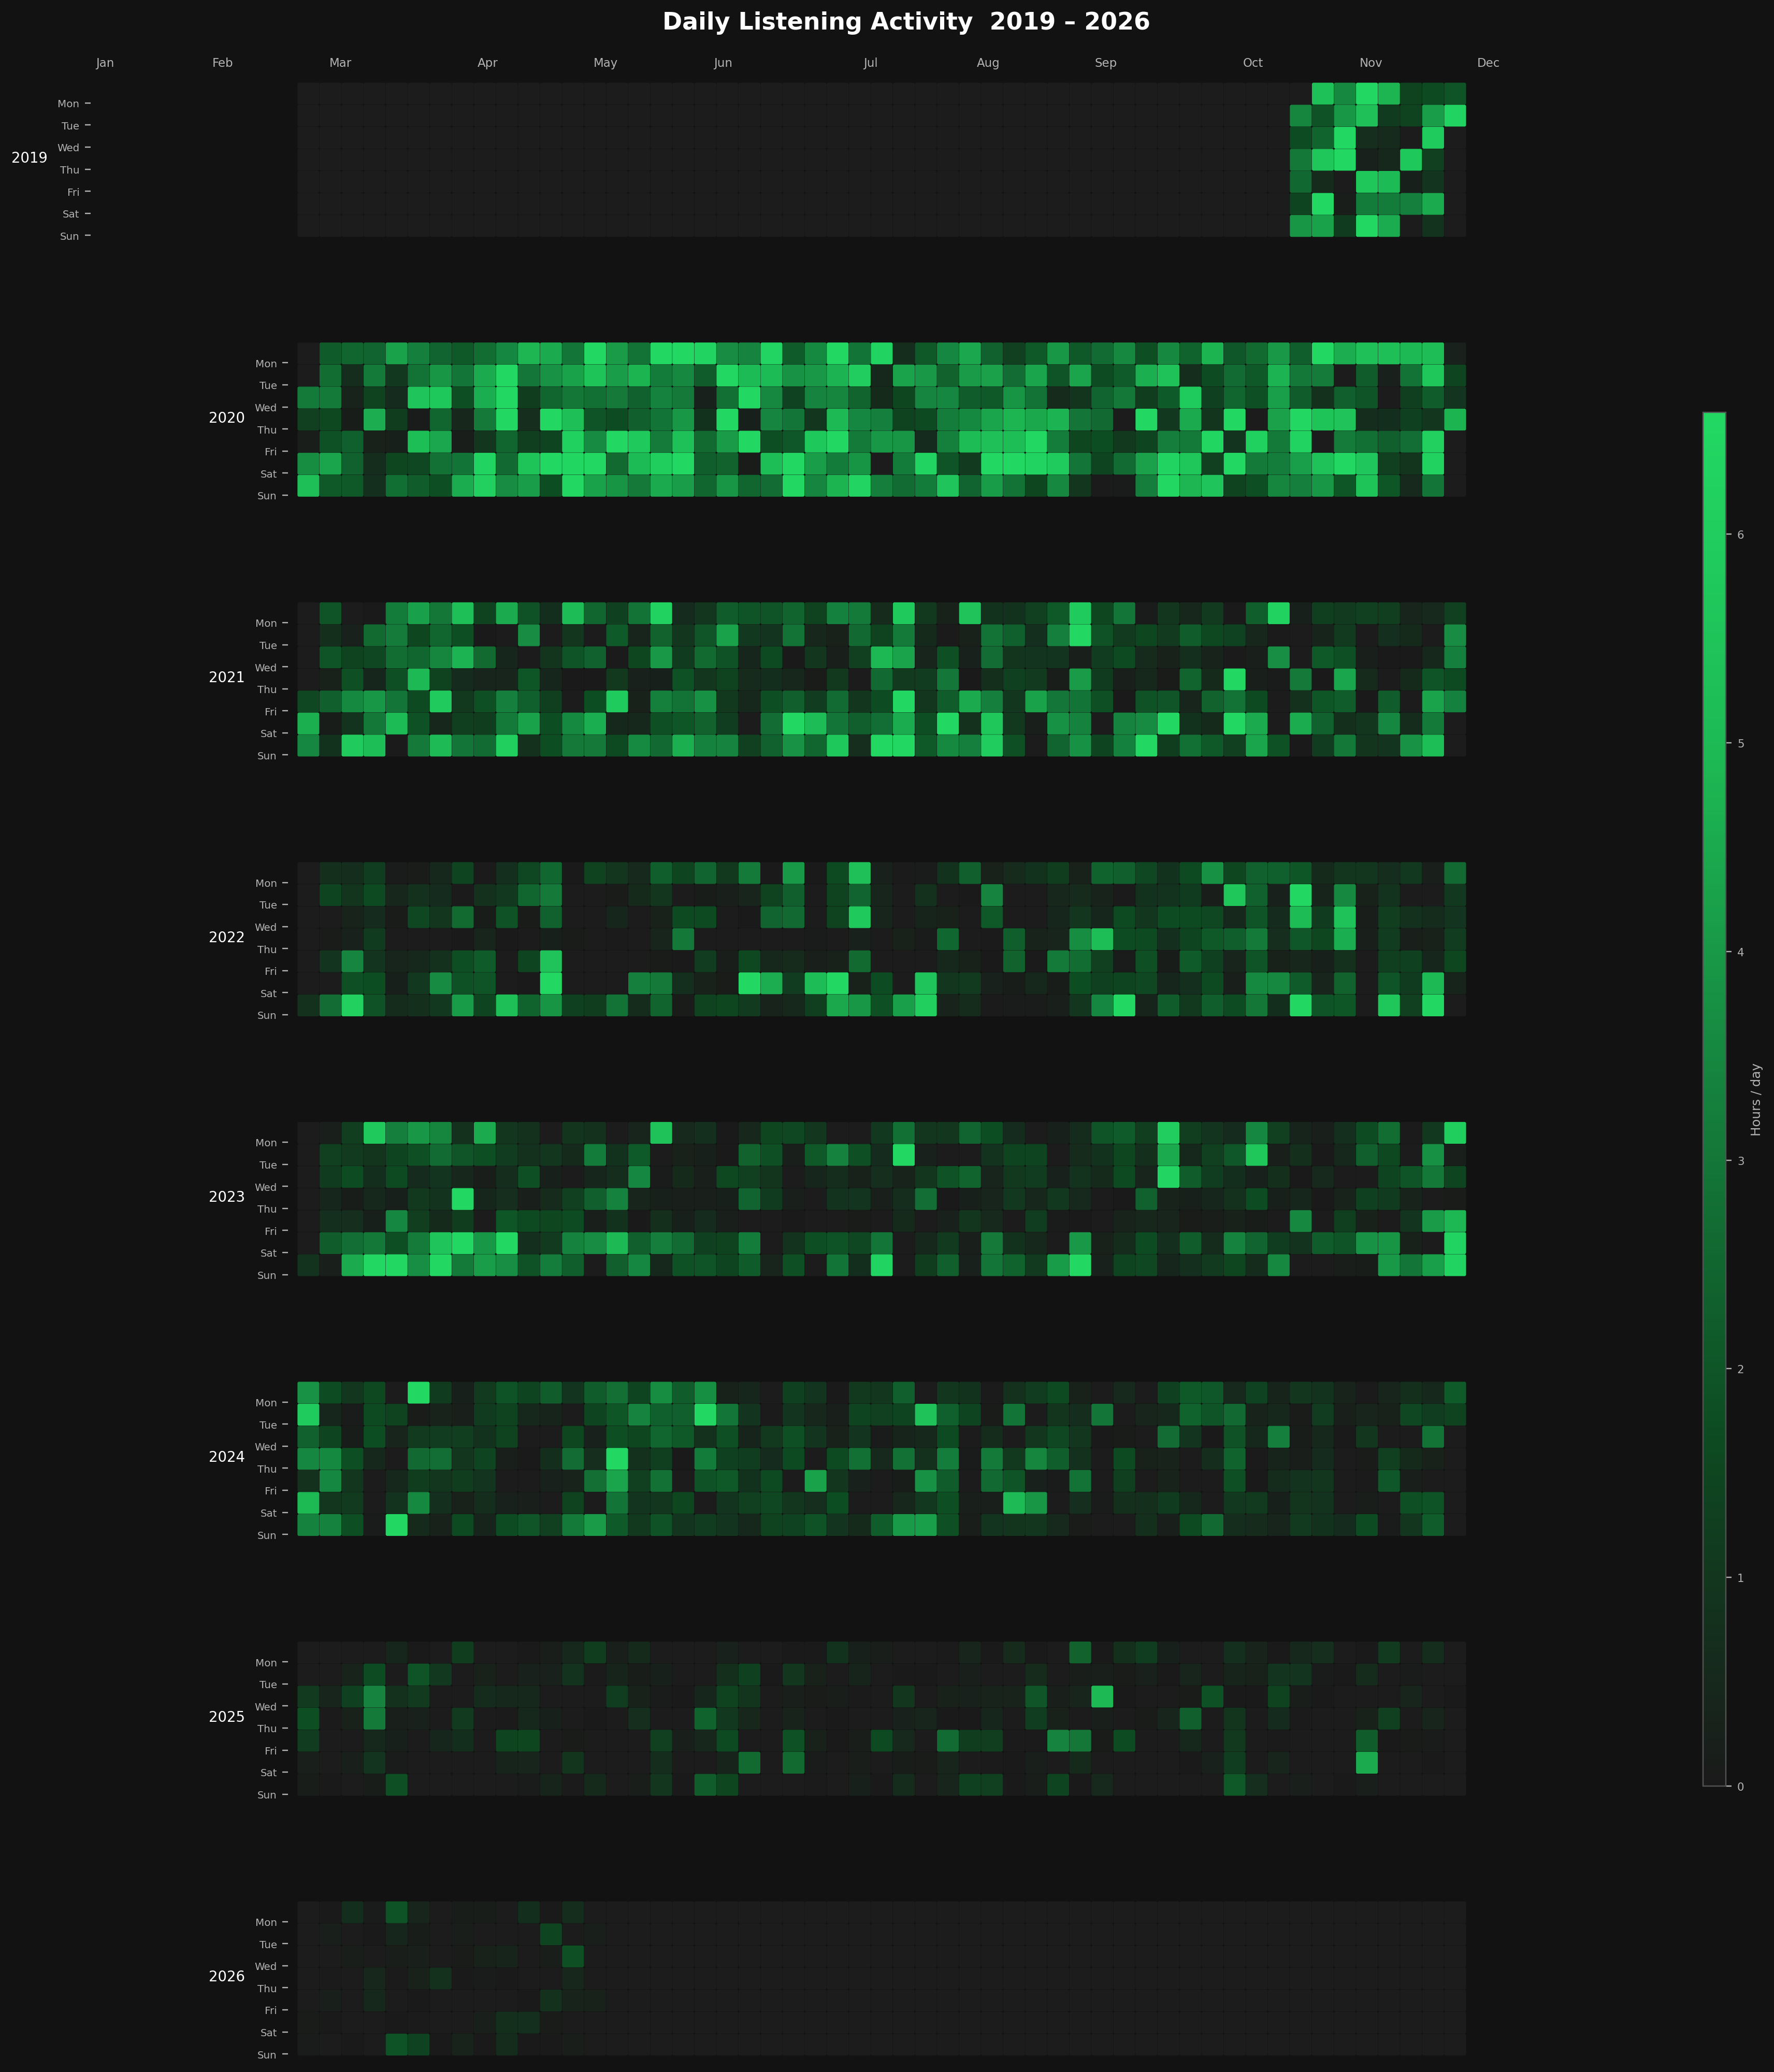
Every day from 2012–2026. Color intensity = hours listened. The 2020 lockdown block is unmistakable.
Artists most common in long spree sessions
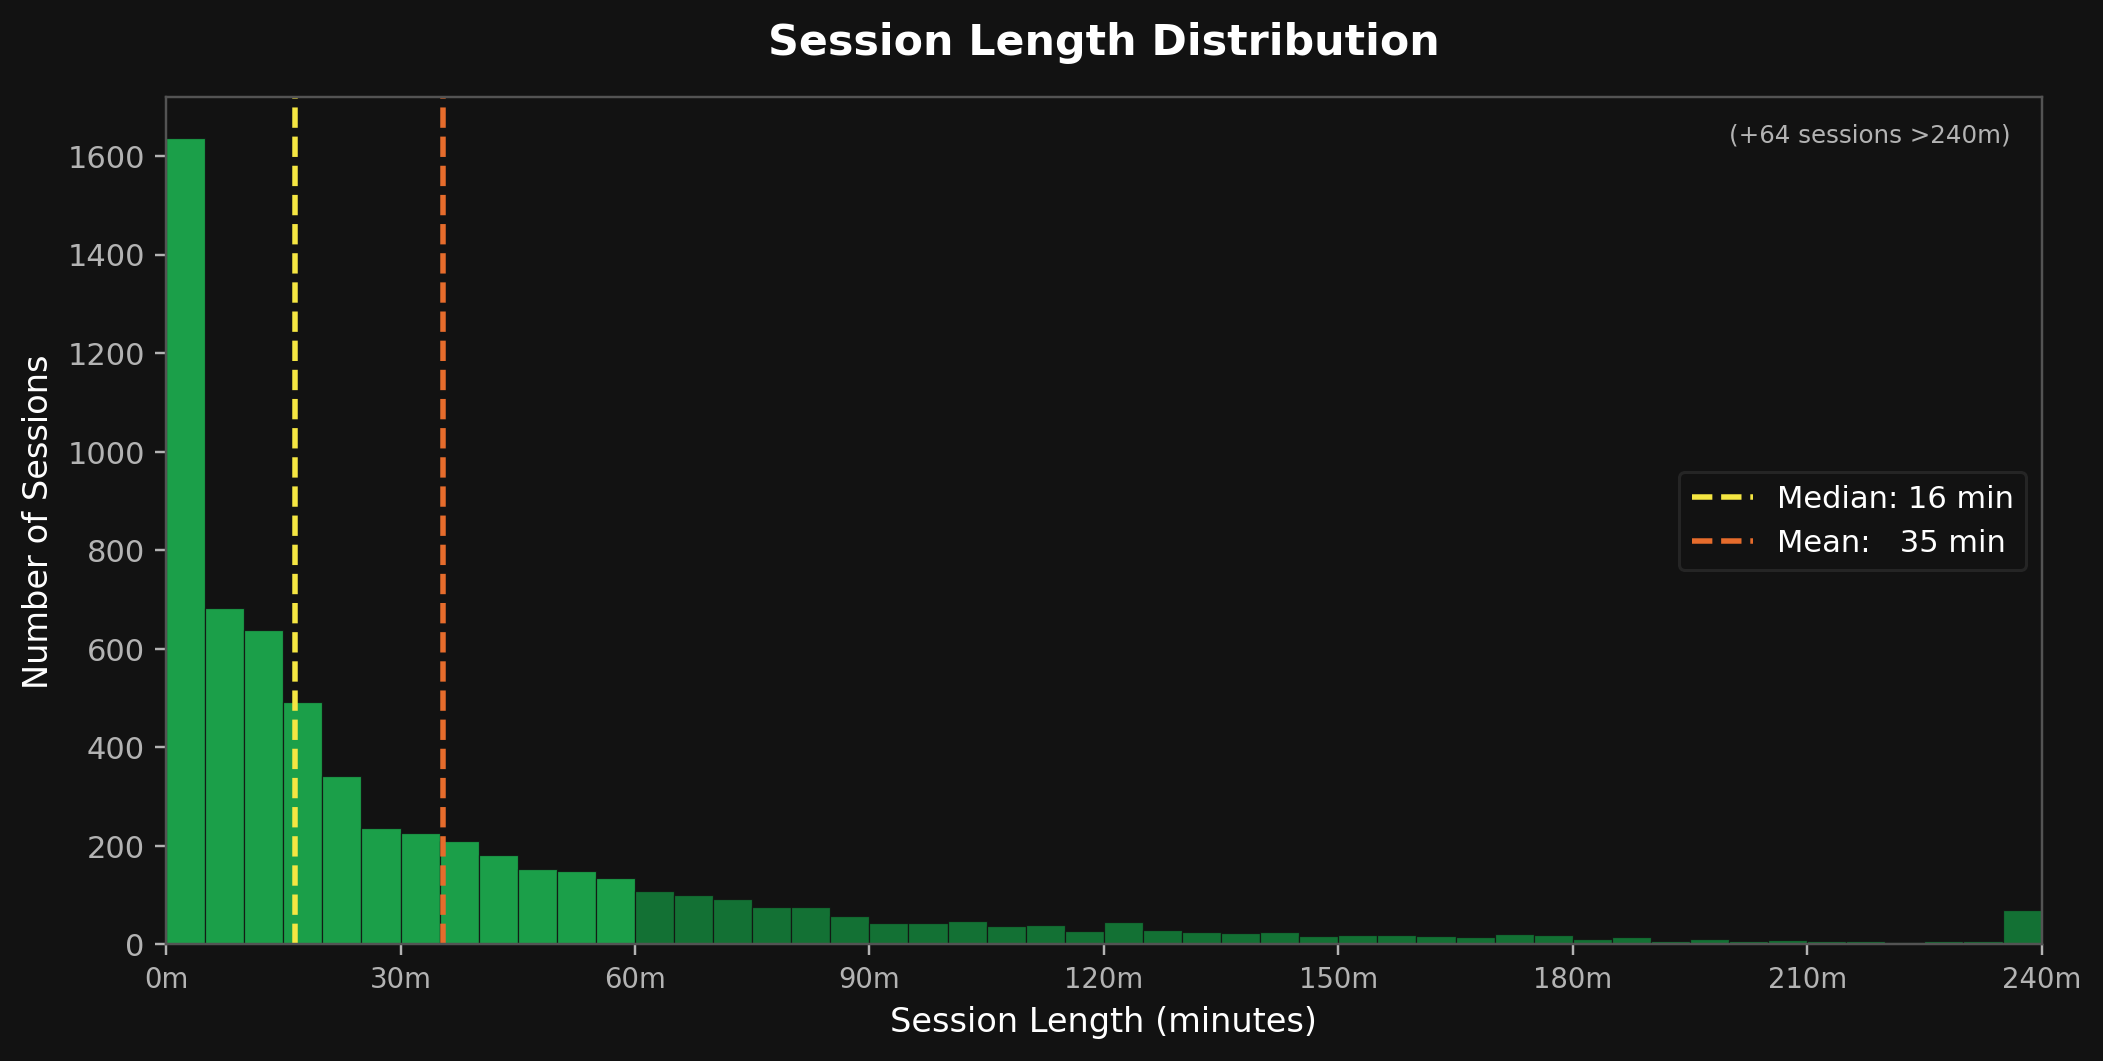
Most sessions are short — but the long tail is where the story lives.
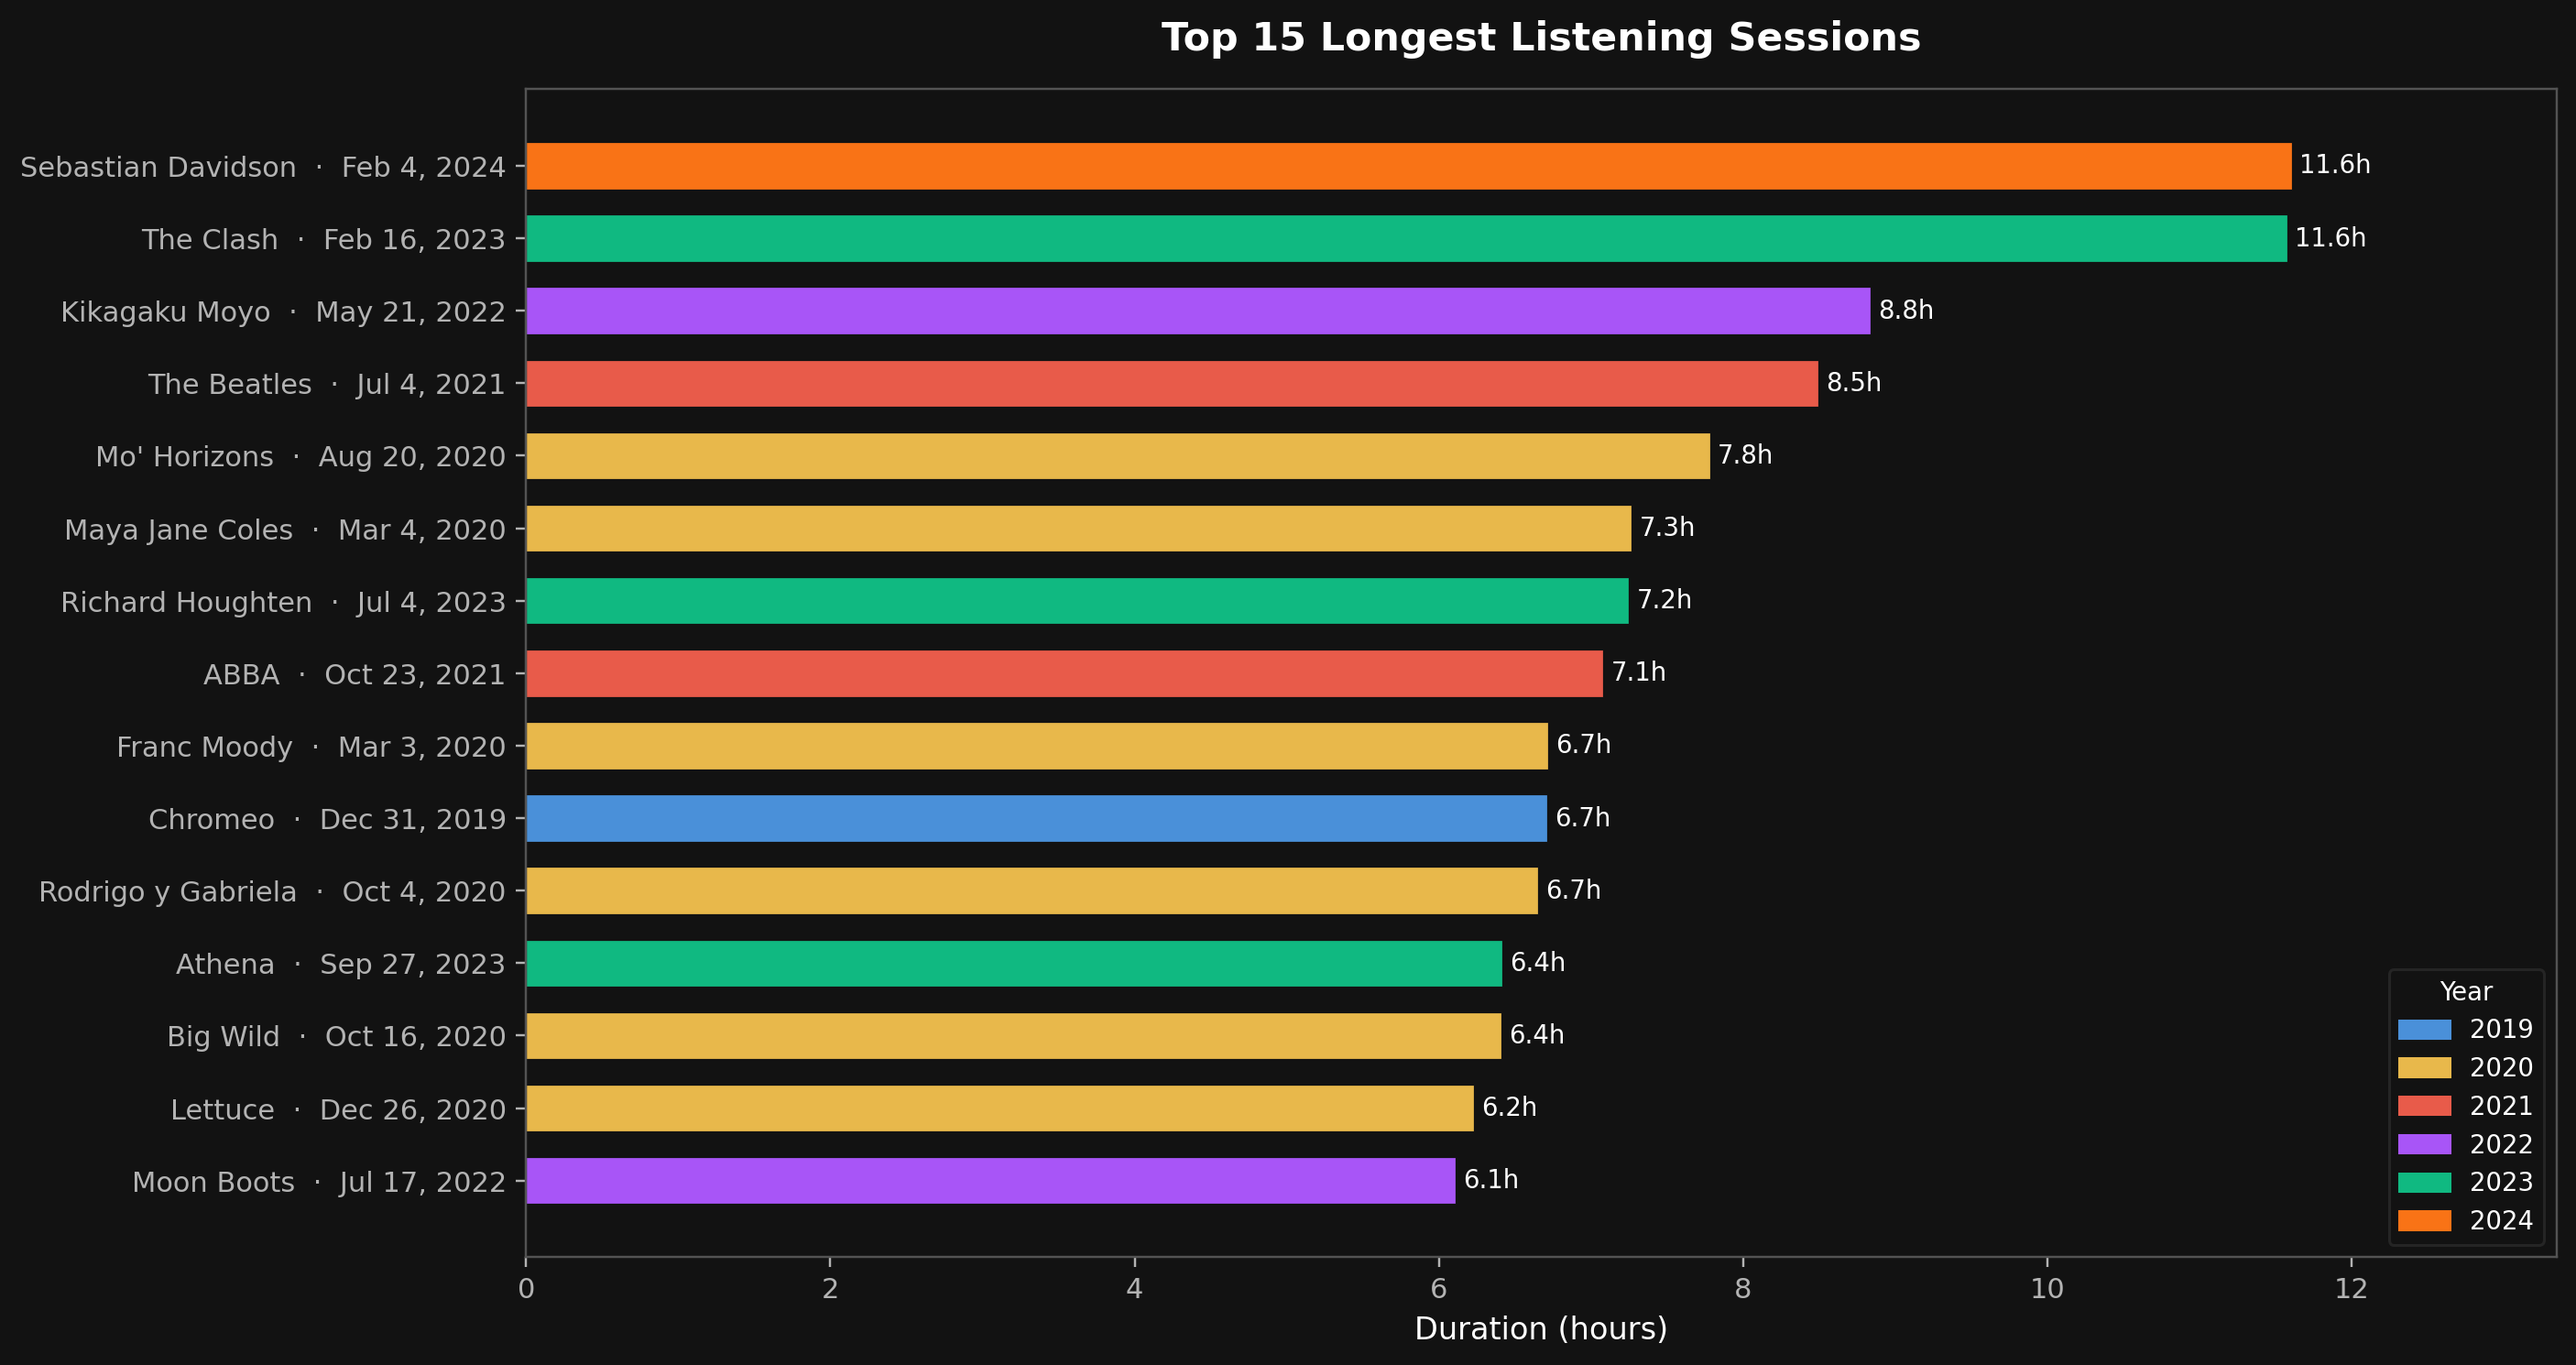
Your 15 longest sprees. Each one is a day that needed music.
11pm is your peak listening hour — late night (10pm–5am) accounts for more streams than any other phase. But morning (8am–12pm) is where you're most selective: highest skip rate at 6.5%, lowest shuffle. You know exactly what you need to start the day, and you reject what doesn't fit.
Sunday is your biggest listening day (ABBA leads). Saturday is second (The Beatles). Monday is surprisingly active — you apparently need music to get back into the week.
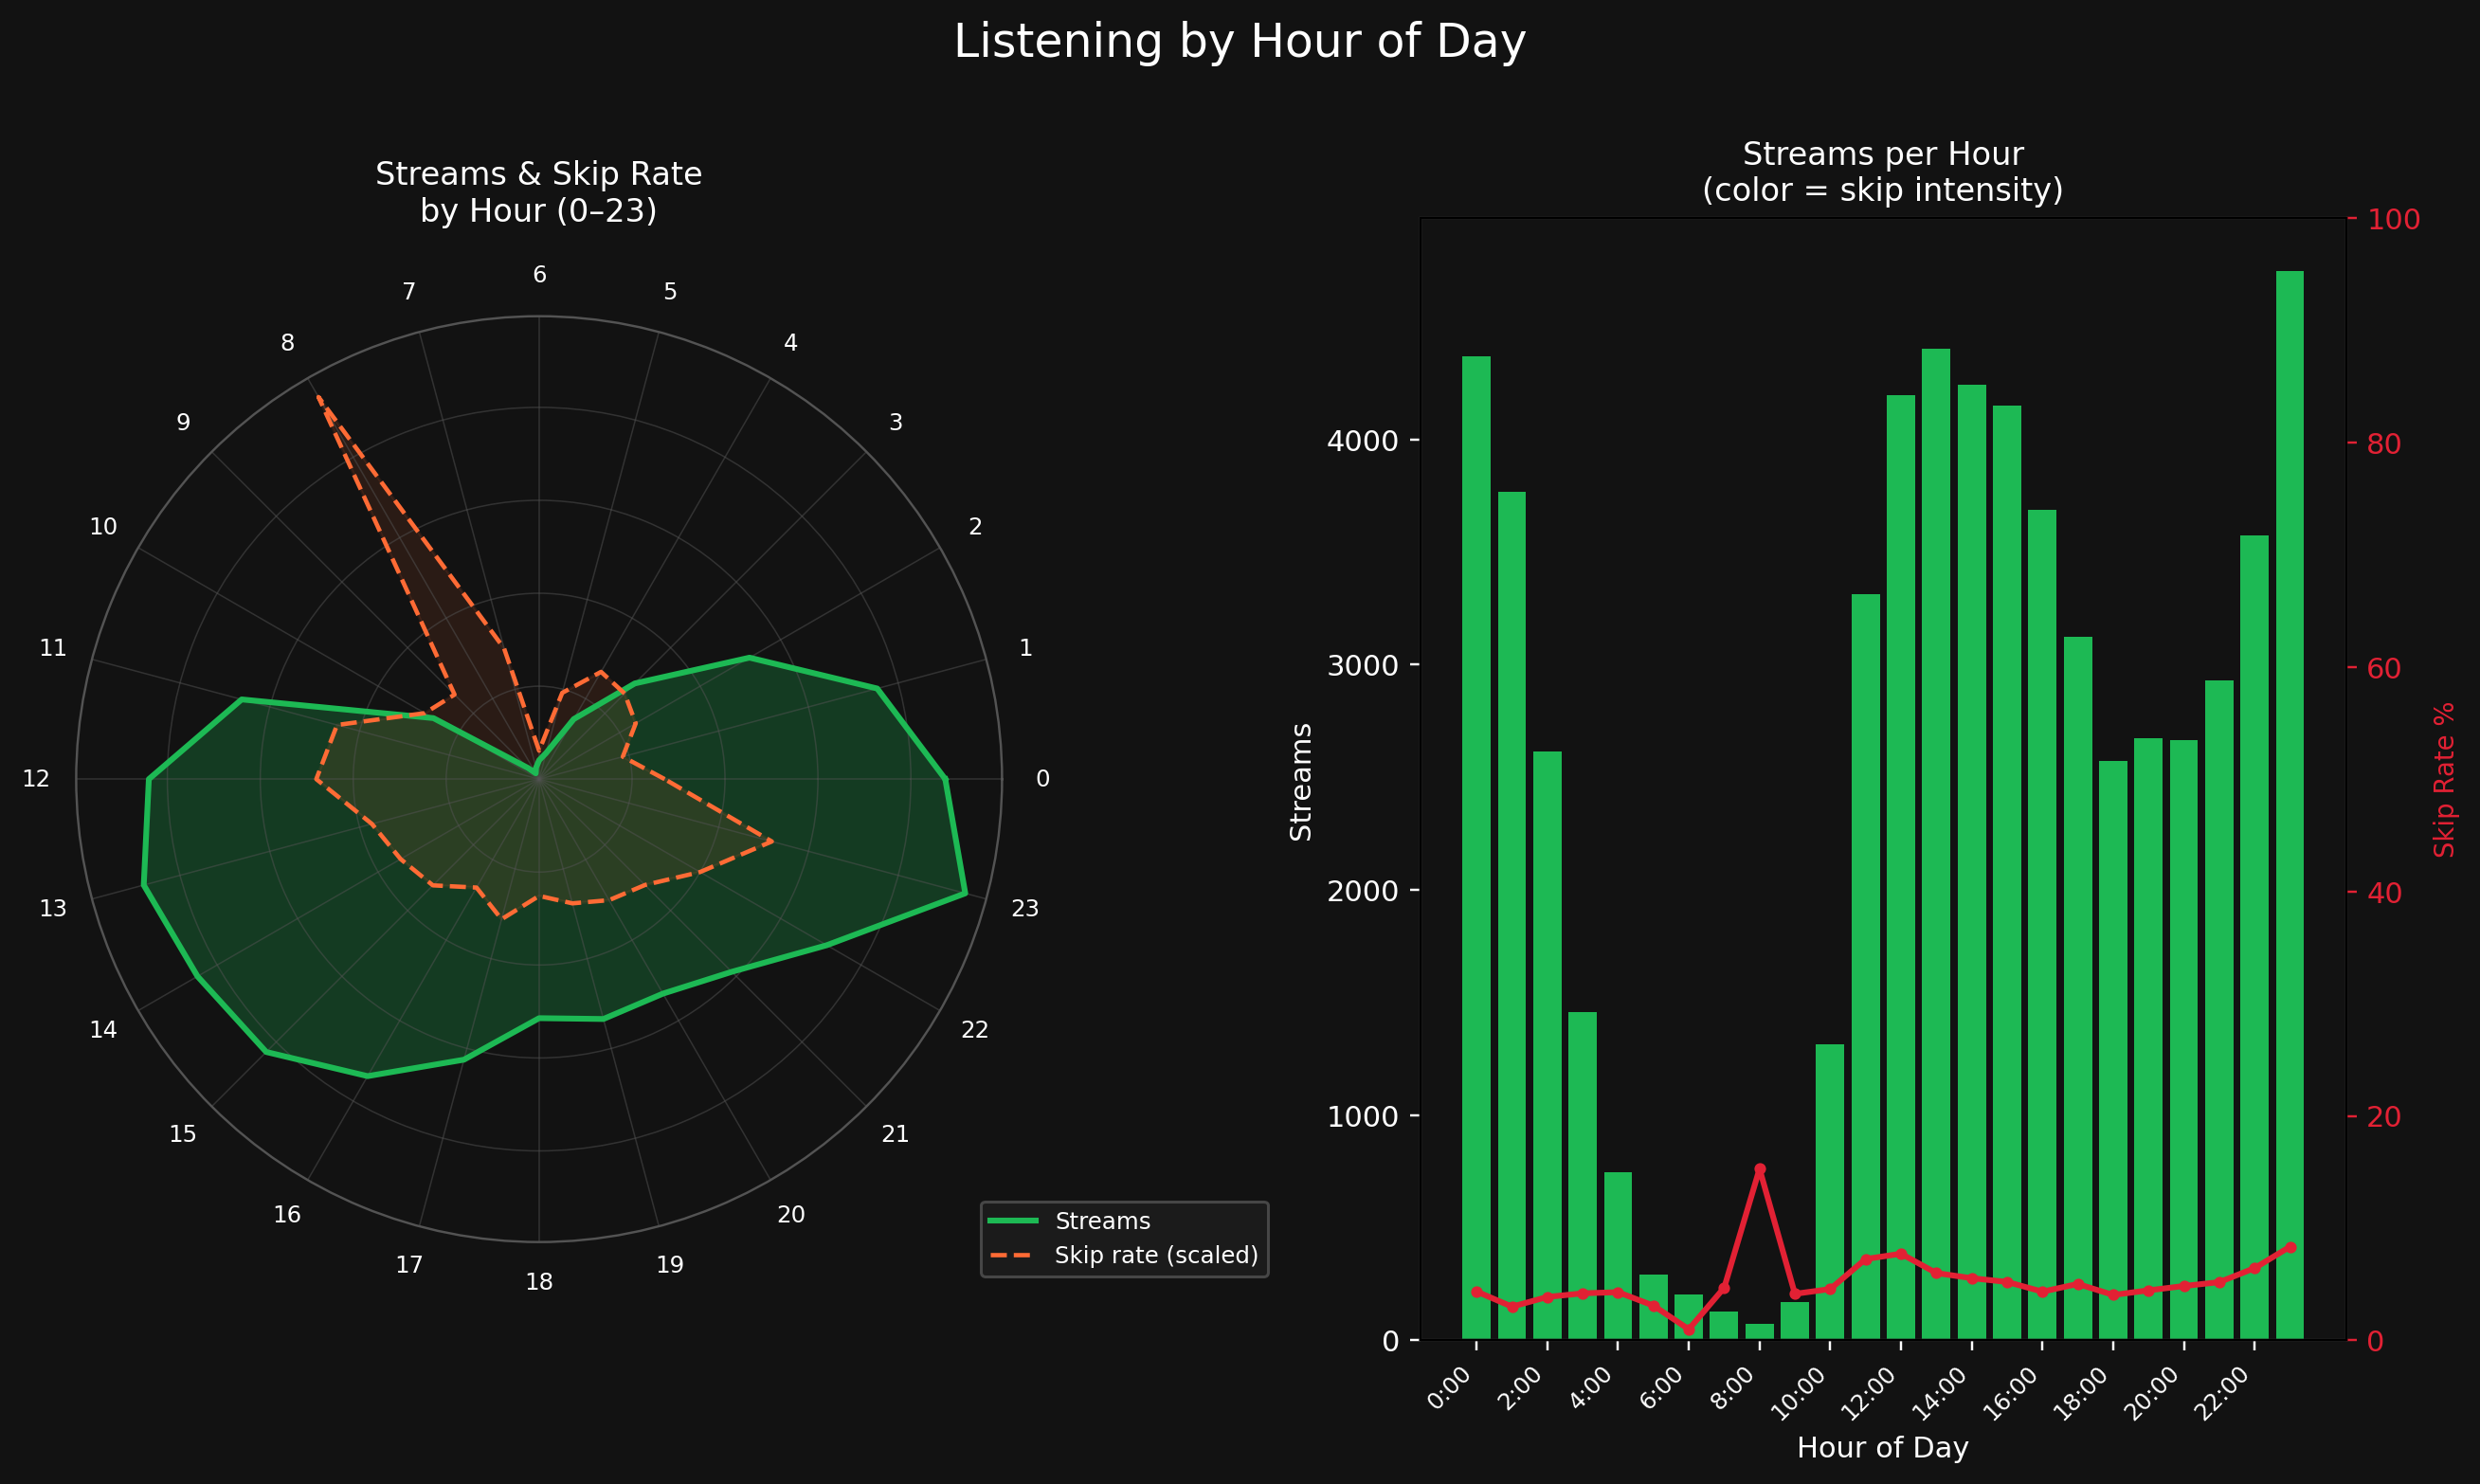
Stream volume and skip rate by hour of day. Late night dominates.
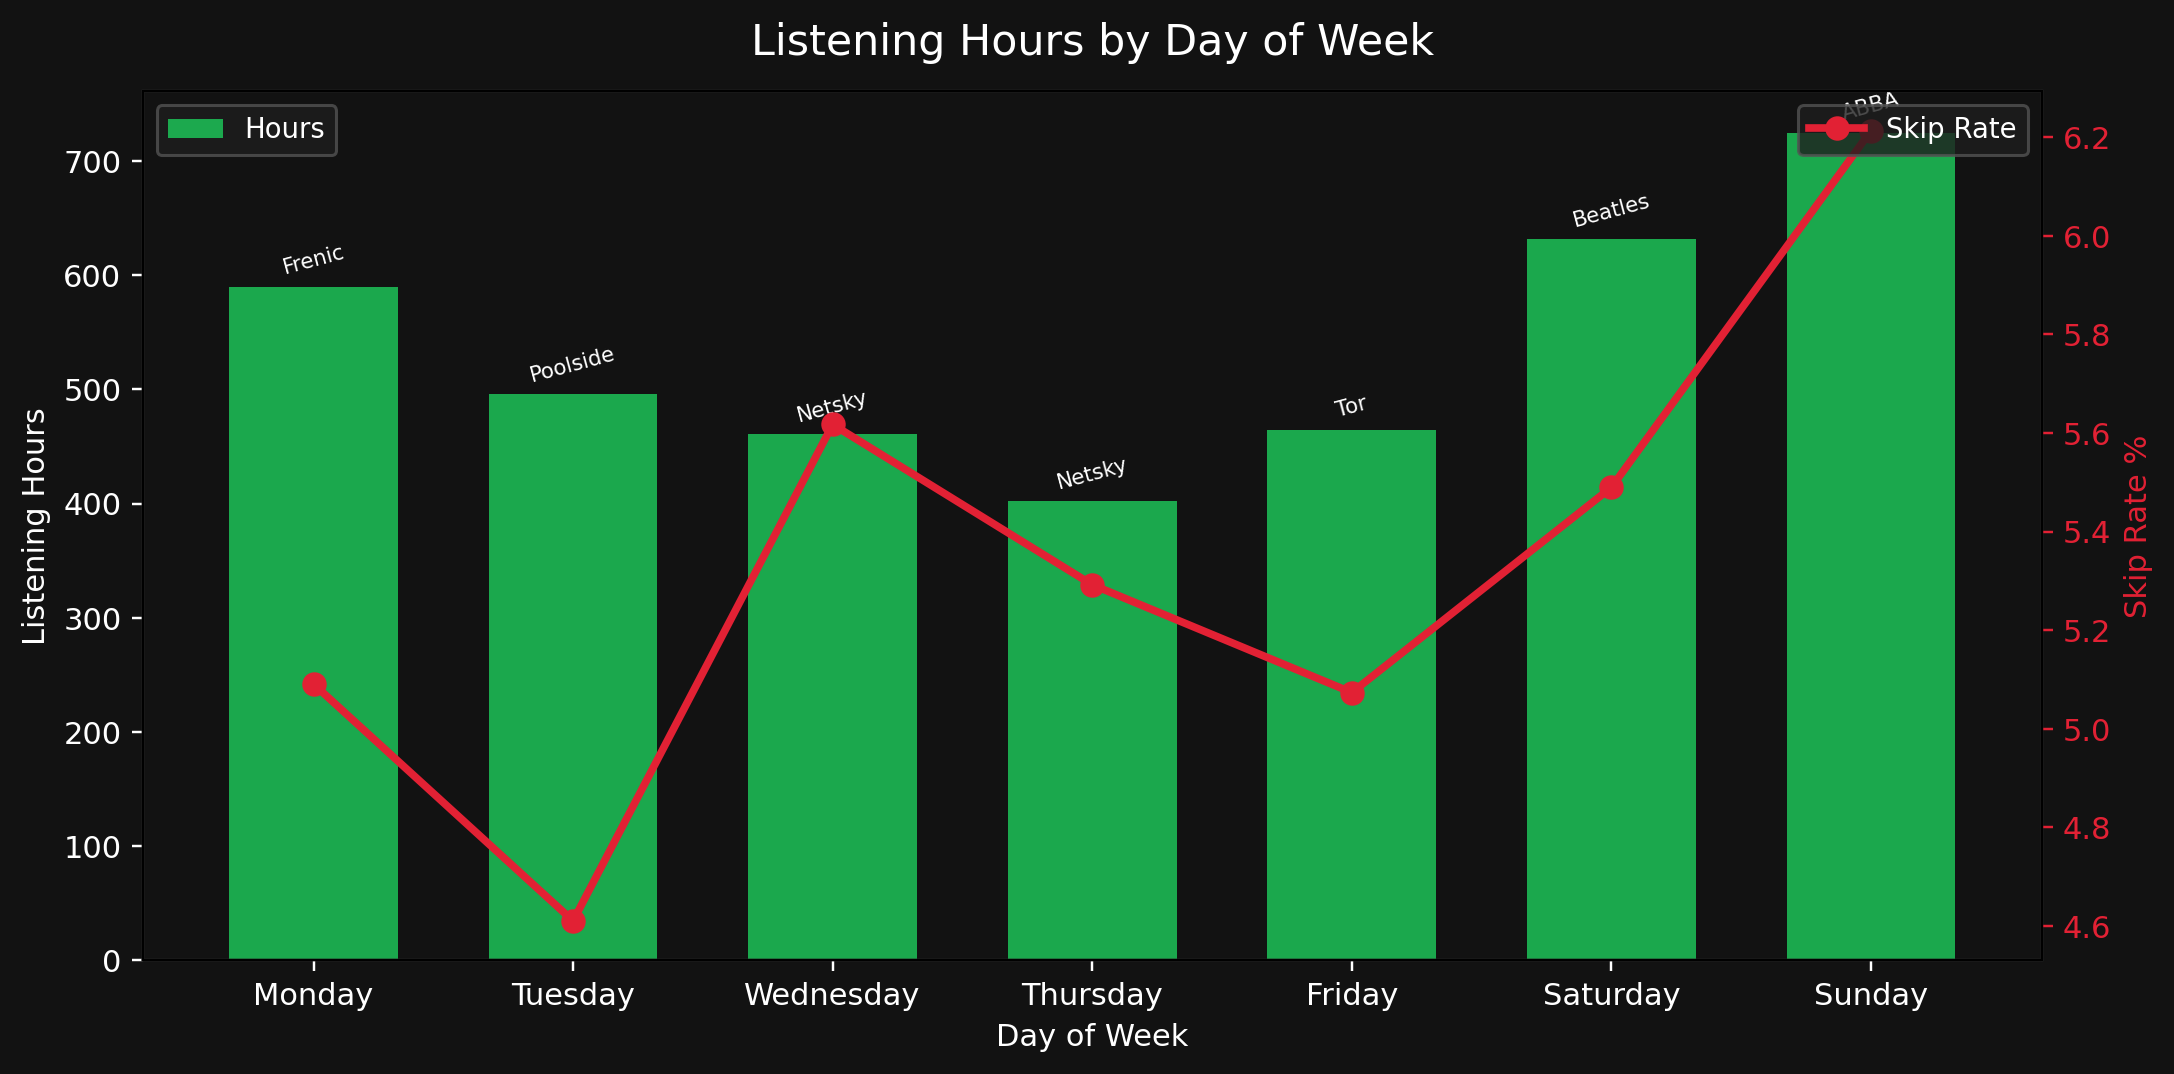
Sunday peaks, Monday is surprisingly strong. Skip rate is highest on Sundays.
Netsky: 123 unique tracks, loyalty score 0.075. You know them deep.
Camo & Krooked: 143 tracks, 62 hours. You really know them.
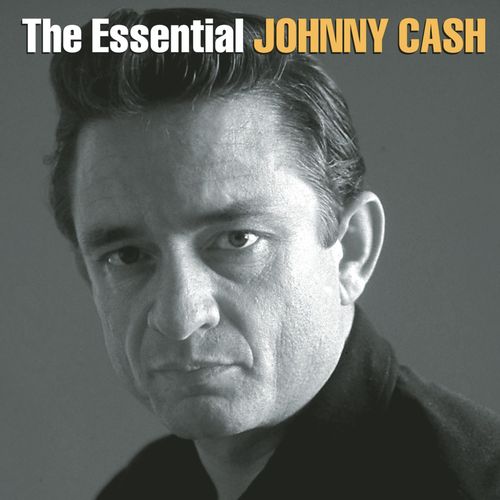
Then there's Johnny Cash — 64% of your plays are Ring of Fire. That's not a music relationship. That's a song relationship.
Justice is your biggest musical breakup — 4.5 hours at peak, completely ghosted after August 2024.
Queen had your most dramatic comeback: 365 days of silence, then came back 3× stronger.
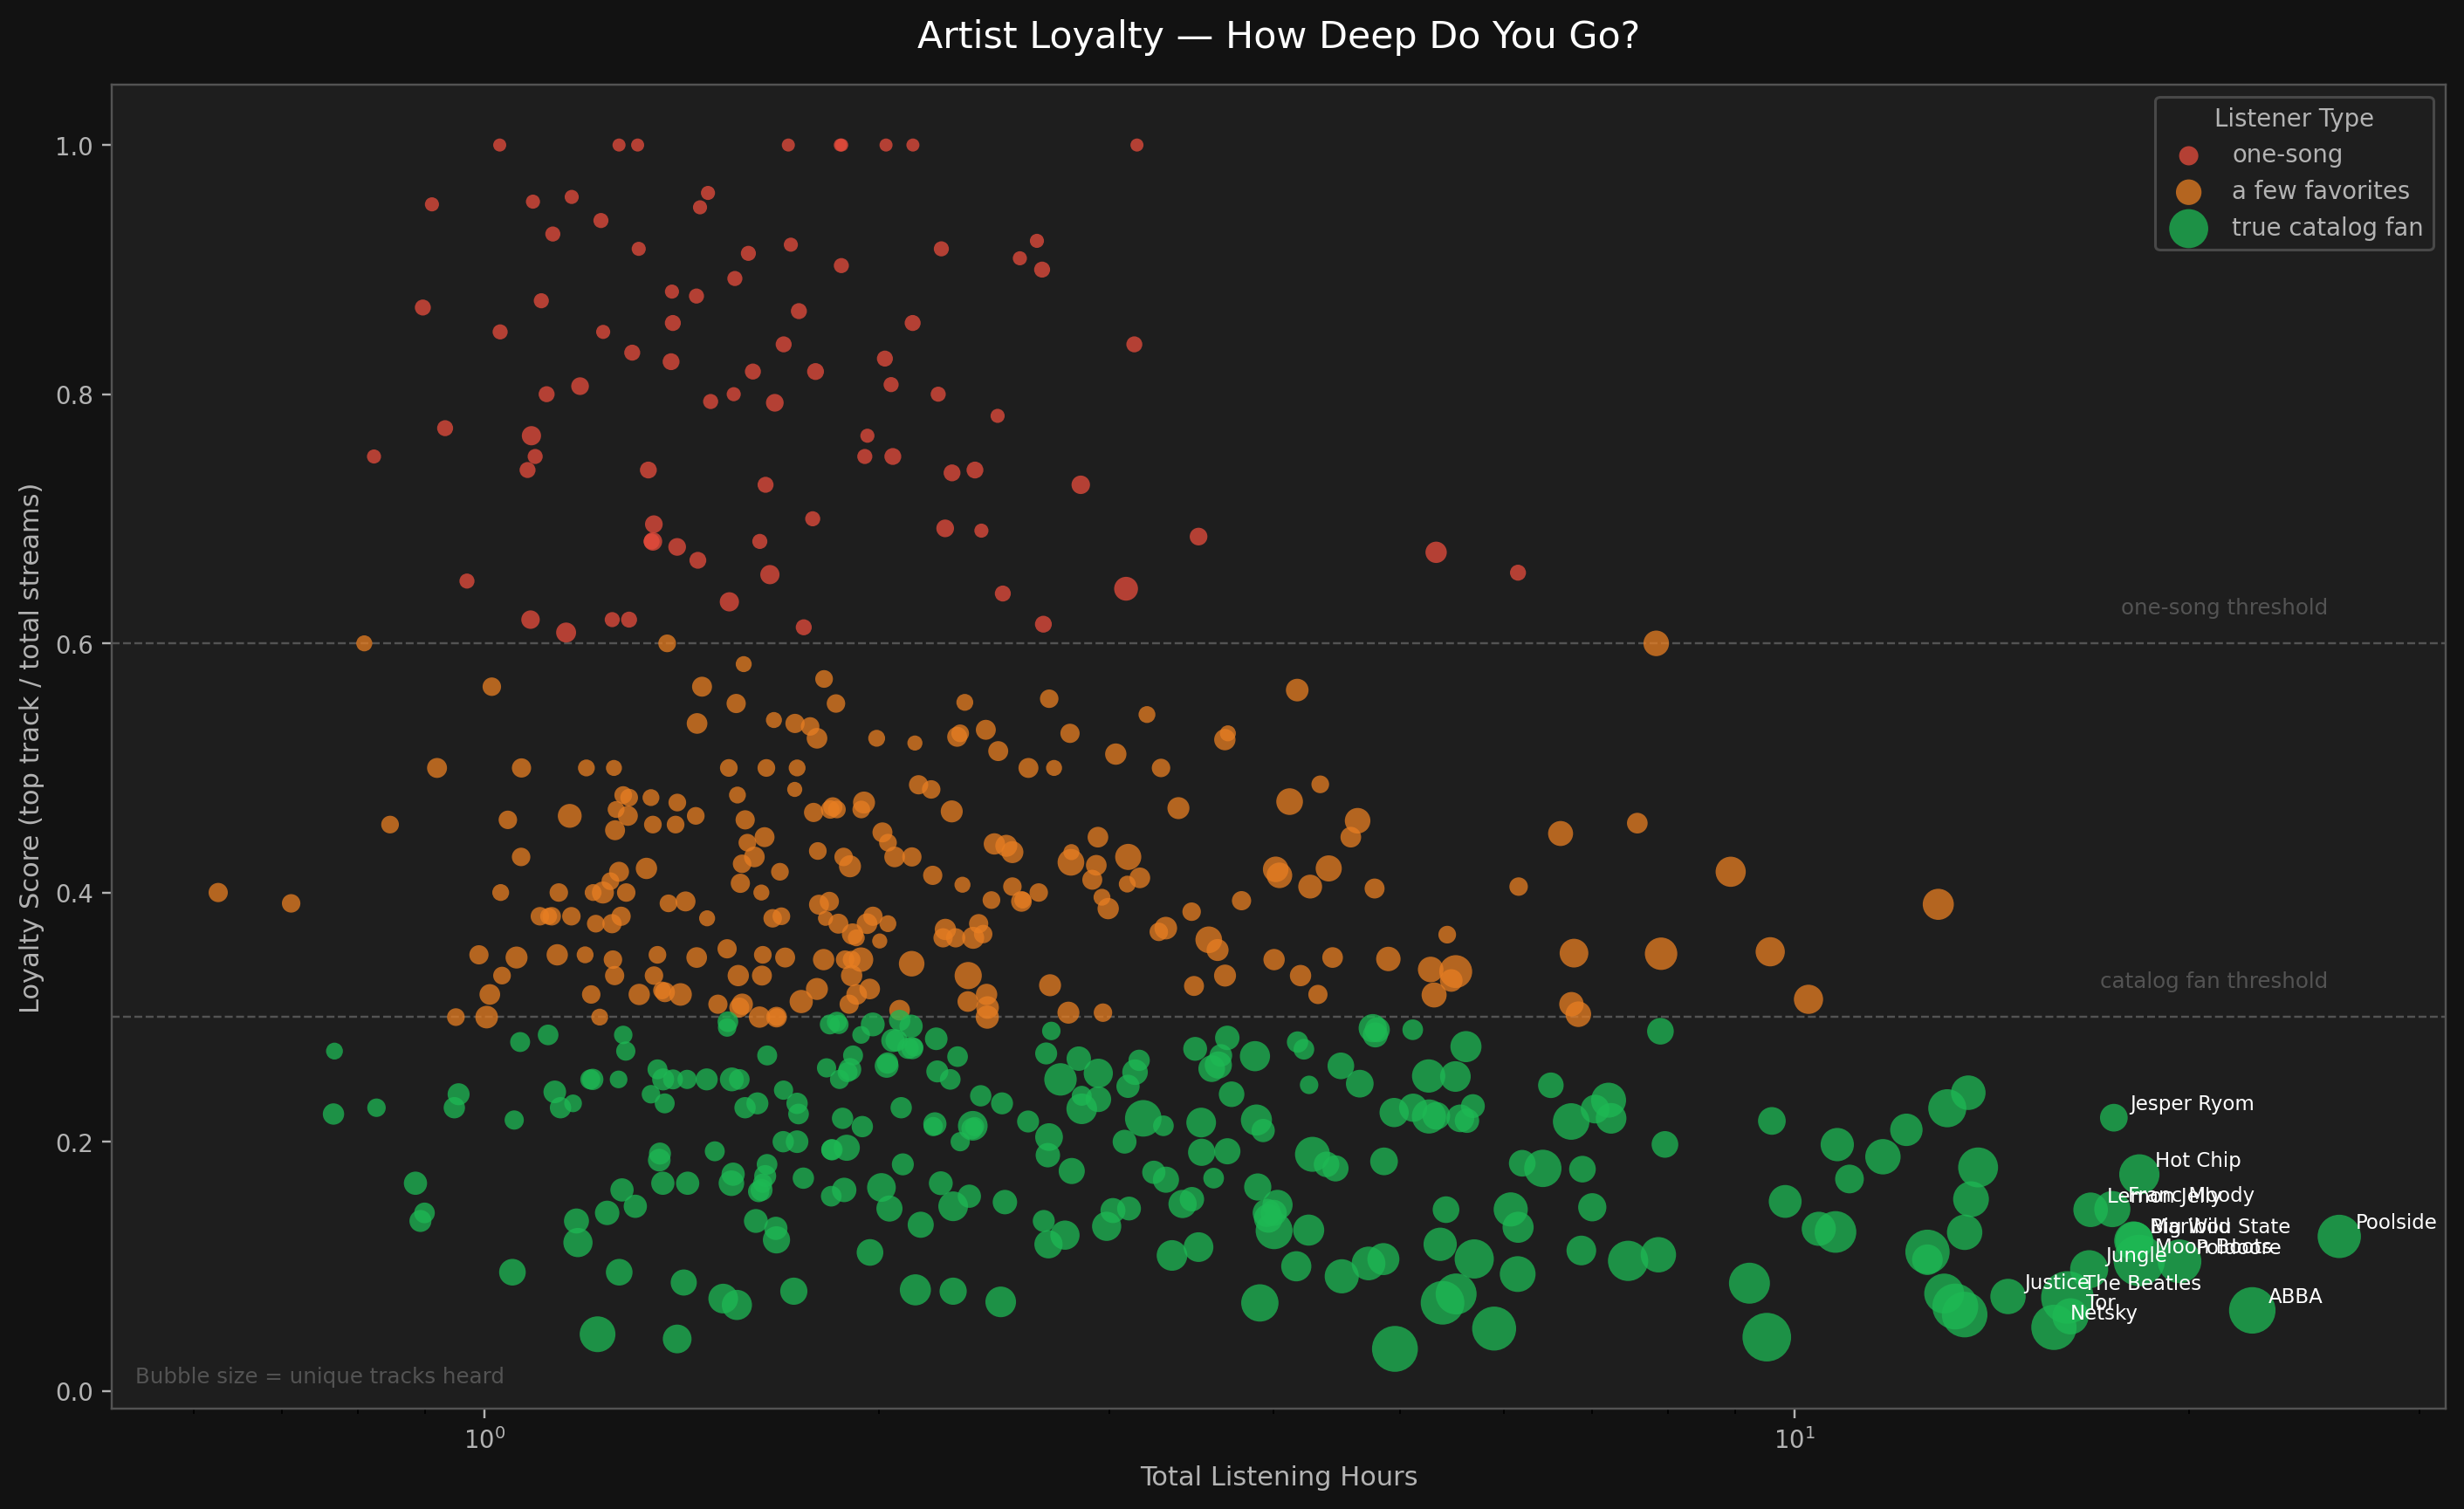
Each bubble is an artist. High on the y-axis = one-song relationship. Low = true catalog fan. Size = unique tracks heard.
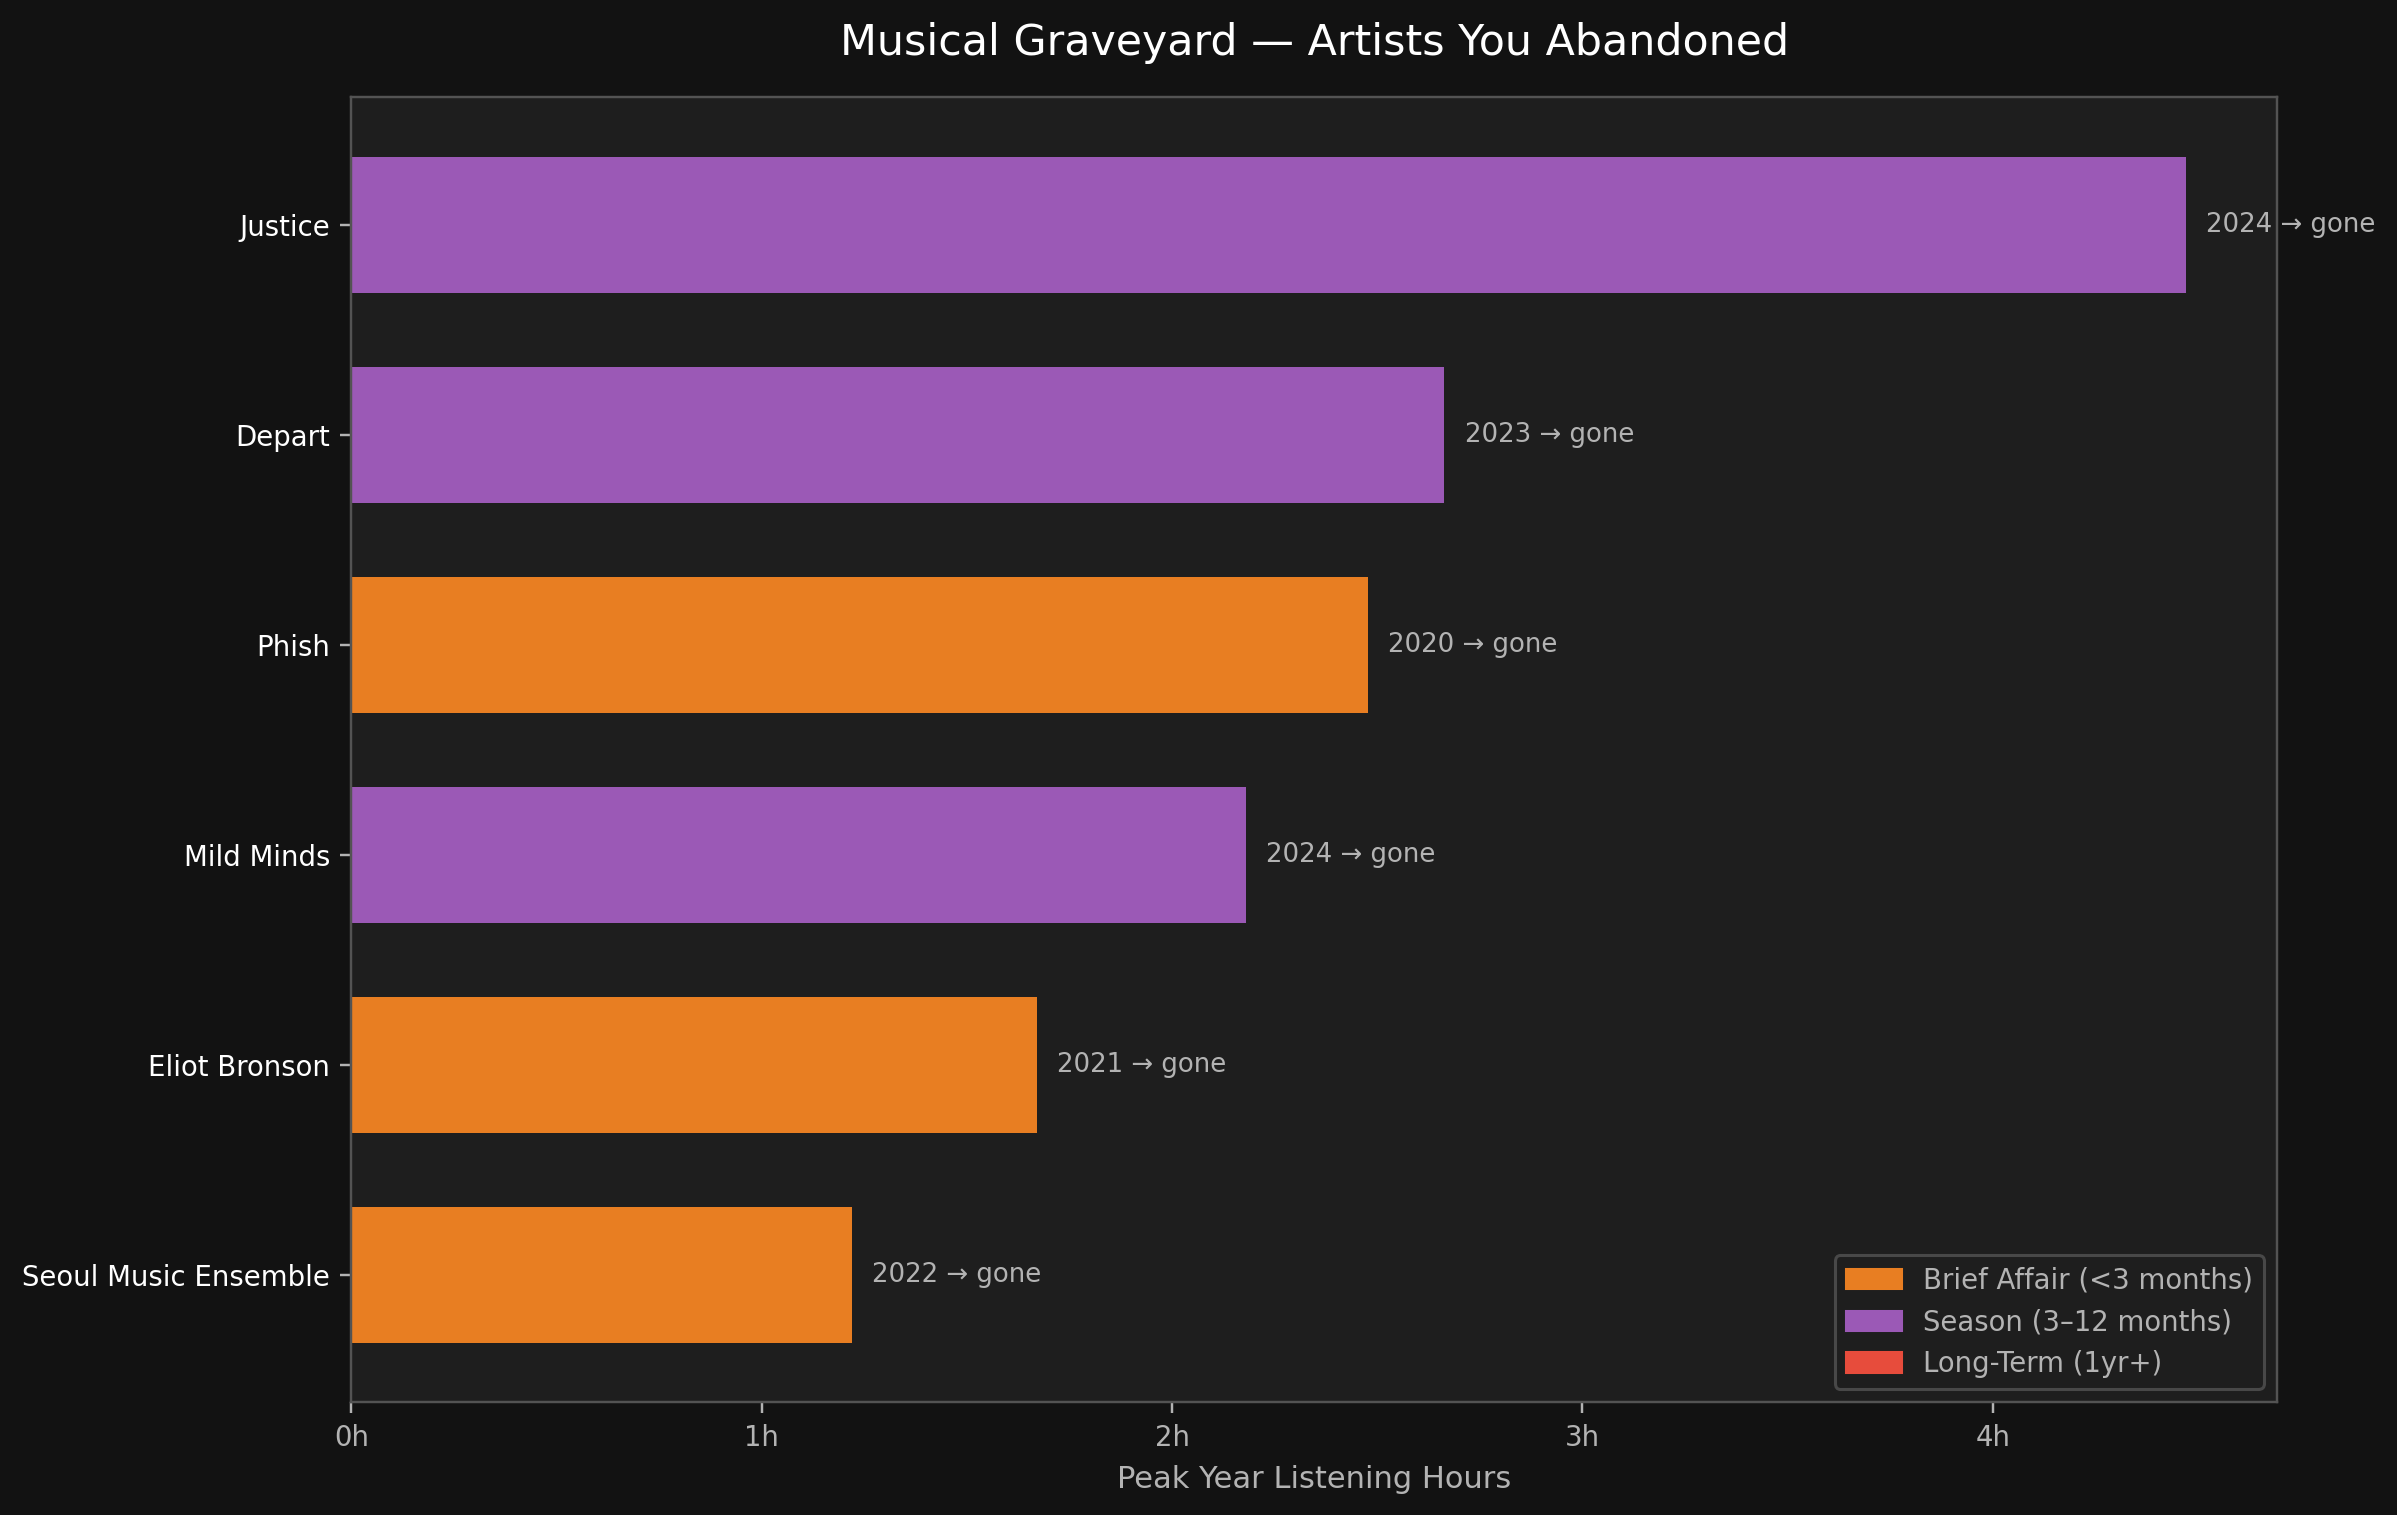
Artists you loved and never returned to. Justice is the freshest wound.
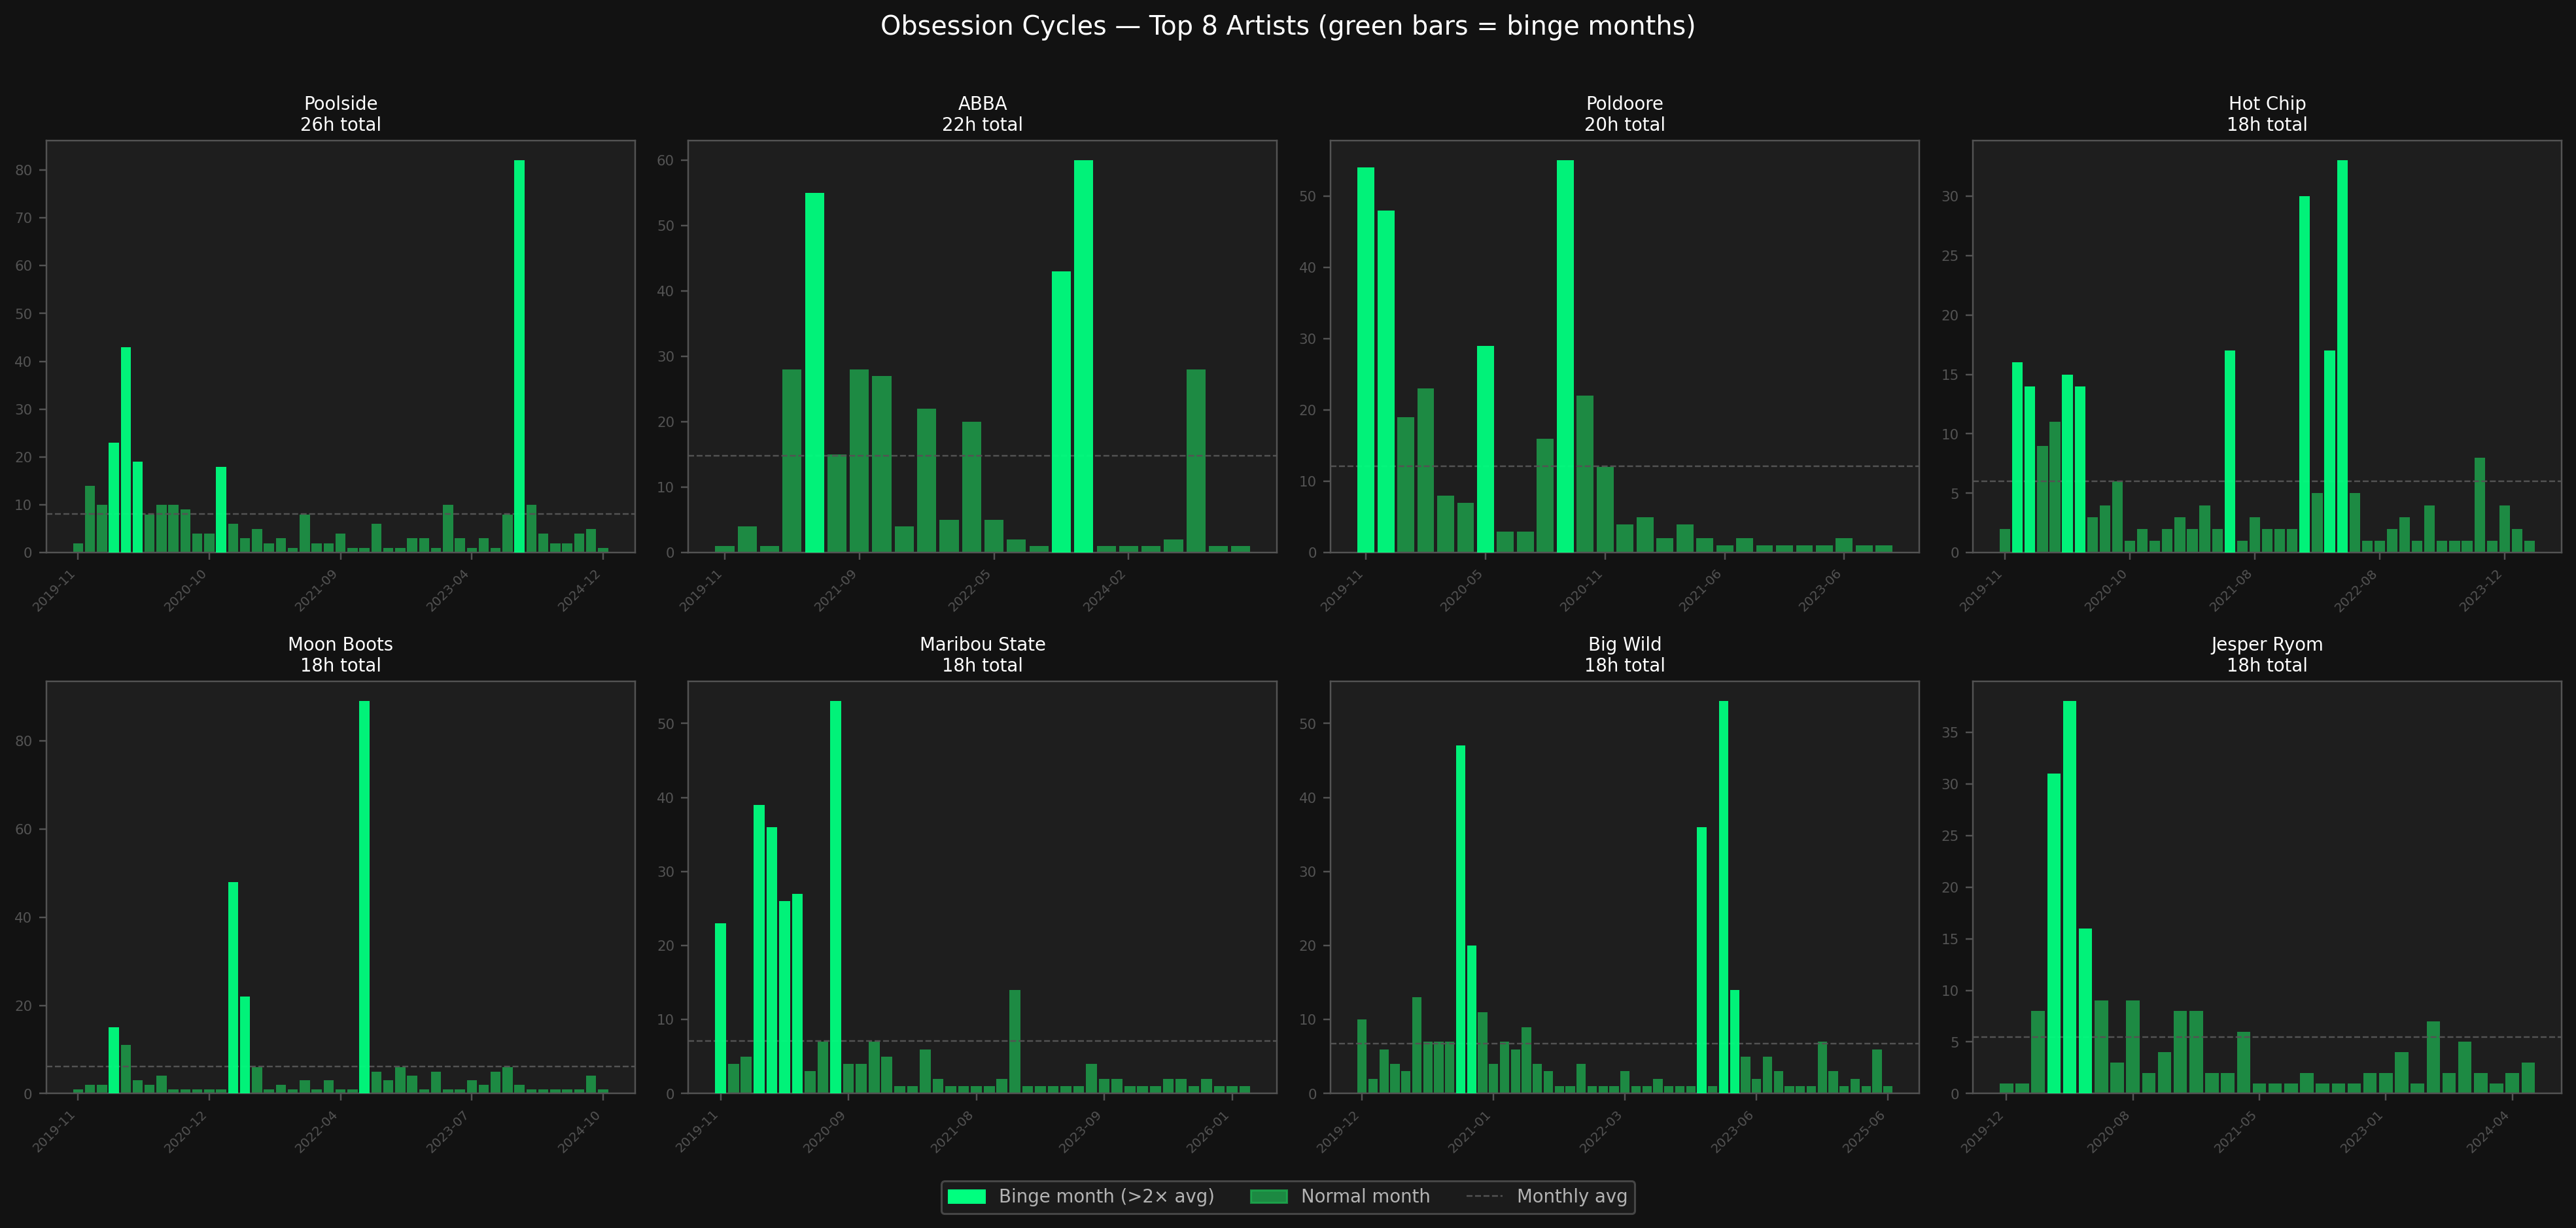
Monthly listening intensity for your top 8 artists. Green spikes = binge phases. You can see exactly when each obsession hit.
The top-level stats hide the most interesting story: this isn't one kind of listening. It's a 14-year arc through drum & bass, nu-disco, chillout, desert blues, and everything in between. Genre isn't a preference — it's a phase. And the phases are visible in the data.
2012–2016 was a DnB era. Committed, deep, and consistent.
Netsky,
Camo & Krooked,
London Elektricity,
High Contrast — six of the top 17 all-time artists are drum and bass.
Then something shifted. The nu-disco and electro wave crested. The chillout years followed.
And in 2024, Tinariwen arrived from nowhere and rewrote the chart entirely.
Listening hours by genre, per year. The DnB dominance of 2012–2016, the nu-disco transition, and the desert blues spike in 2024 are all visible.
The DnB era ran from 2012–2016. That's not nostalgia — it's 4+ years of consistent, high-volume listening to a specific subgenre. Then it gradually gave way to broader electronic and nu-disco sounds before the chillout and downtempo era took over.
Monthly genre breakdown — the shape of a changing taste over 14 years. Each color is a different genre family.
Year by Year — Who Was #1
Drag the slider to see your top 5 artists for any year from 2012 to 2026.
The averages are fine. The edge cases are where the actual life shows up.

Every artist is a star. The connections are your co-listening sessions — artists heard together in the same sitting, weighted by how often they travel together. No genre database, no external labels. Pure listening behaviour across 5,550 sessions, 1,301 artists, and seven years of choices. Drag nodes, zoom in, click any artist to see who they connect to and what you haven't explored yet.
Top 250 artists shown · Node size = hours listened · Lines = session co-occurrence (PMI-weighted) · Clusters via Louvain community detection · Drag to explore · Scroll to zoom
Each cluster emerged purely from co-listening — no genre tags used. Recency score shows how much of this cluster's listening has happened since 2024.